Research article
Finding Earth 2.0 in Distant Worlds
A reproducible, data-driven search for potentially Earth-like worlds across the public astronomical archives.
Author: Biswajit Jana · Generated 2026-08-28 from the analysis pipeline (earth2 v1.0.1)
1. Abstract
Among the 6,354 planets confirmed by the NASA Exoplanet Archive as of this analysis, we ask a narrowly scoped question: which known planets most closely satisfy physically motivated conditions associated with an Earth-like, potentially habitable world, how strong is the observational evidence behind each, and where does that evidence run out? We ingest 164,209 source-tracked records from 13 NASA Exoplanet Archive tables, cross-reference public radial-velocity holdings from DACE and light curves from MAST, propagate every published measurement uncertainty through 4,000 Monte Carlo draws per planet, and rank candidates on four independent, interpretable axes. The central finding is a scarcity result: only 15 planets are simultaneously inside the conservative habitable zone and small enough to be plausibly rocky, and only 1 of those has an actually measured mass. We do not claim evidence of life, habitability, or a confirmed second Earth for any object in this catalogue.
2. The search for another Earth
The public framing of exoplanet discovery habitually collapses several distinct claims into one headline: “Earth-sized”, “in the habitable zone”, “potentially habitable”, and occasionally “could host life”. These are not synonyms. A planet can be Earth-sized and molten. A planet can sit in the habitable zone and be a mini-Neptune with no solid surface at all. This project treats the conflation itself as a problem worth engineering around: every metric it computes answers one and only one of these questions, and every result surfaces which question it is answering.
3. What does “Earth-like” actually mean?
We decompose “Earth-like” into five components that are measured, or fail to be measured, independently: Earth similarity (bulk radius, density, escape velocity, and equilibrium temperature resemble Earth’s); habitable-zone position (incident stellar flux is compatible with surface liquid water under a stated climate model); rocky plausibility (radius sits below the regime where planets are predominantly volatile-rich); atmospheric observability (whether a real atmospheric measurement is feasible with current instruments); and evidence for life, which this project does not attempt to quantify for any planet. Conflating the first four with the fifth is, in our view, the single most common error in public communication about exoplanets.
4. Public datasets
The analysis spine is the NASA Exoplanet Archive’s pscomppars table (one row per confirmed planet, columns drawn from the best available publication per parameter) cross-checked against ps (one coherent row per published parameter set, used to count independent references and measure inter-publication disagreement). Because a pscomppars row may combine values from several papers, it is not assumed to be one internally coherent physical solution: the pipeline counts its per-parameter sources and compares overlapping values with the archive’sdefault_flag=1 solution. Mixed-source is disclosed, not automatically penalised. Atmospheric measurements come from the archive’s transitspec and emissionspec tables: 5,948 genuine transmission-spectroscopy measurements across 104 planets. Transit photometry is retrieved live from MAST via lightkurve. Radial velocities are retrieved live from the public holdings of the Data & Analysis Center for Exoplanets (DACE), University of Geneva. Full per-dataset source records — the literal query, retrieval timestamp, and a SHA-256 of the payload as received — is in Data sources. Host-star distances are additionally cross-checked against Gaia DR3 by exact source_id — never coordinate matching, which risks silently pairing the wrong star in crowded fields — for every host the archive itself links to a Gaia identifier.
Independent distance check
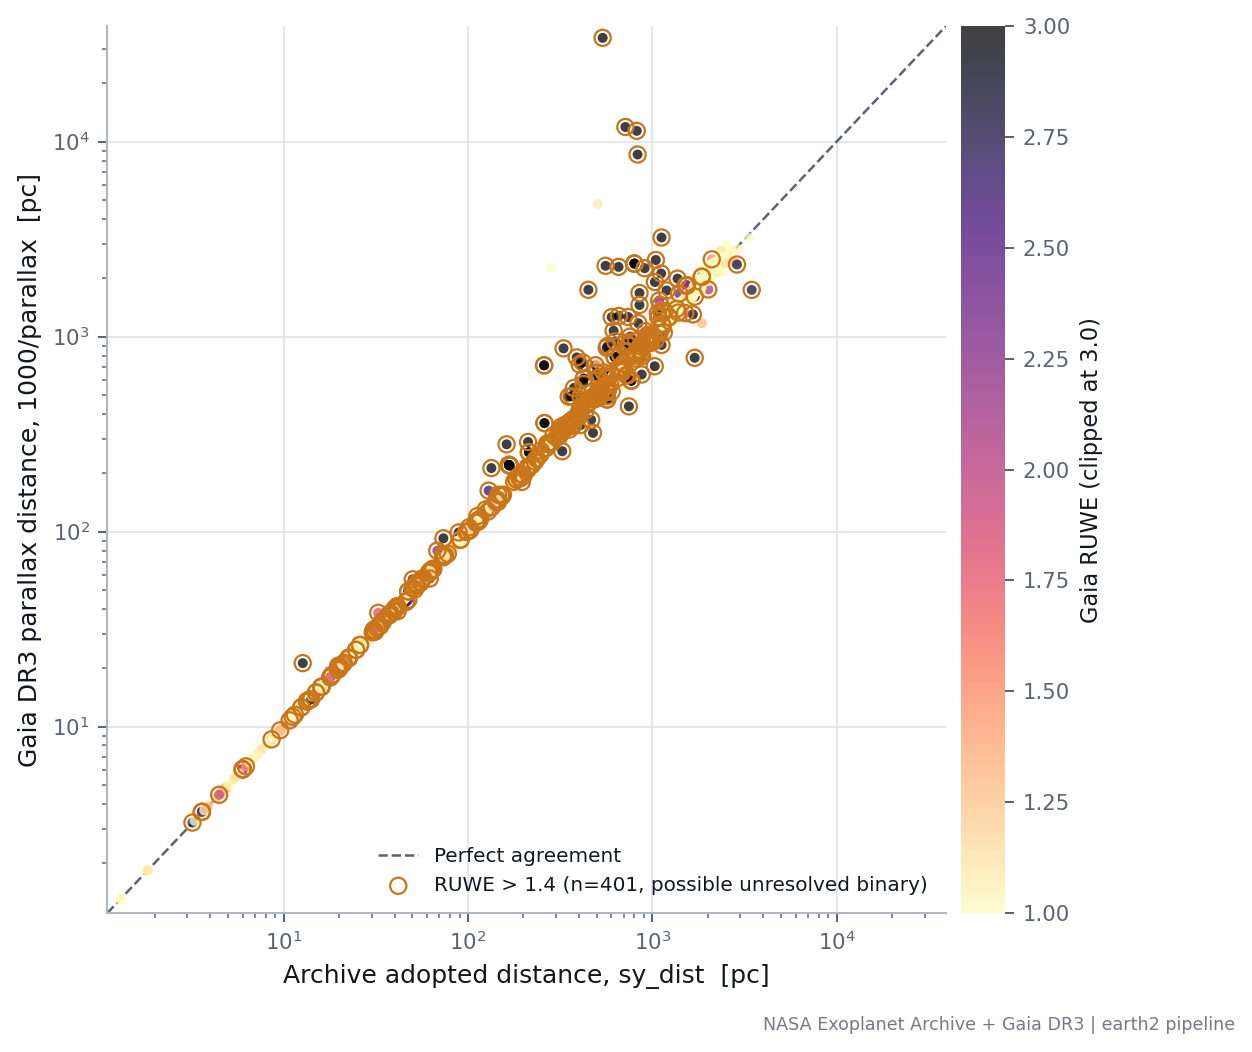
source_id: the archive’s adopted distance against 1000/parallax computed directly from this project’s own Gaia crossmatch. Points are coloured by Gaia’s RUWE statistic; outlined points exceed RUWE > 1.4, the conventional threshold for a poorly-fit or unresolved-binary astrometric solution. The two distances agree to a median of 0.73% across all matched hosts.5. Data architecture
The pipeline is a five-stage, deterministic Python package: ingestion (with per-retrieval manifests), catalogue construction (mass-evidence classification, self-consistent flux and temperature derivation), uncertainty propagation (Monte Carlo), ranking (four interpretable scores combined by a non-compensatory geometric mean), and reporting (figures, deep dives, and the JSON this website consumes). Every transformation is appended to a transformation ledger alongside its equation, its citation, and its input/output row counts, so any number on this page can be traced back to the archive row that produced it.
6. Sample construction
The confirmed-planet sample (6,354 planets across 4,764 host systems) is the archive’s full pscomppars table, unfiltered by detection method or discovery year. We additionally ingest TESS Objects of Interest, Kepler Objects of Interest, K2 candidates, and Kepler Threshold Crossing Events as separate, explicitly labelled candidate populations — never merged into the confirmed count, and in the case of TCEs, the large majority of which are not planets at all, used only to characterise detection sensitivity.
Detection is a distance problem
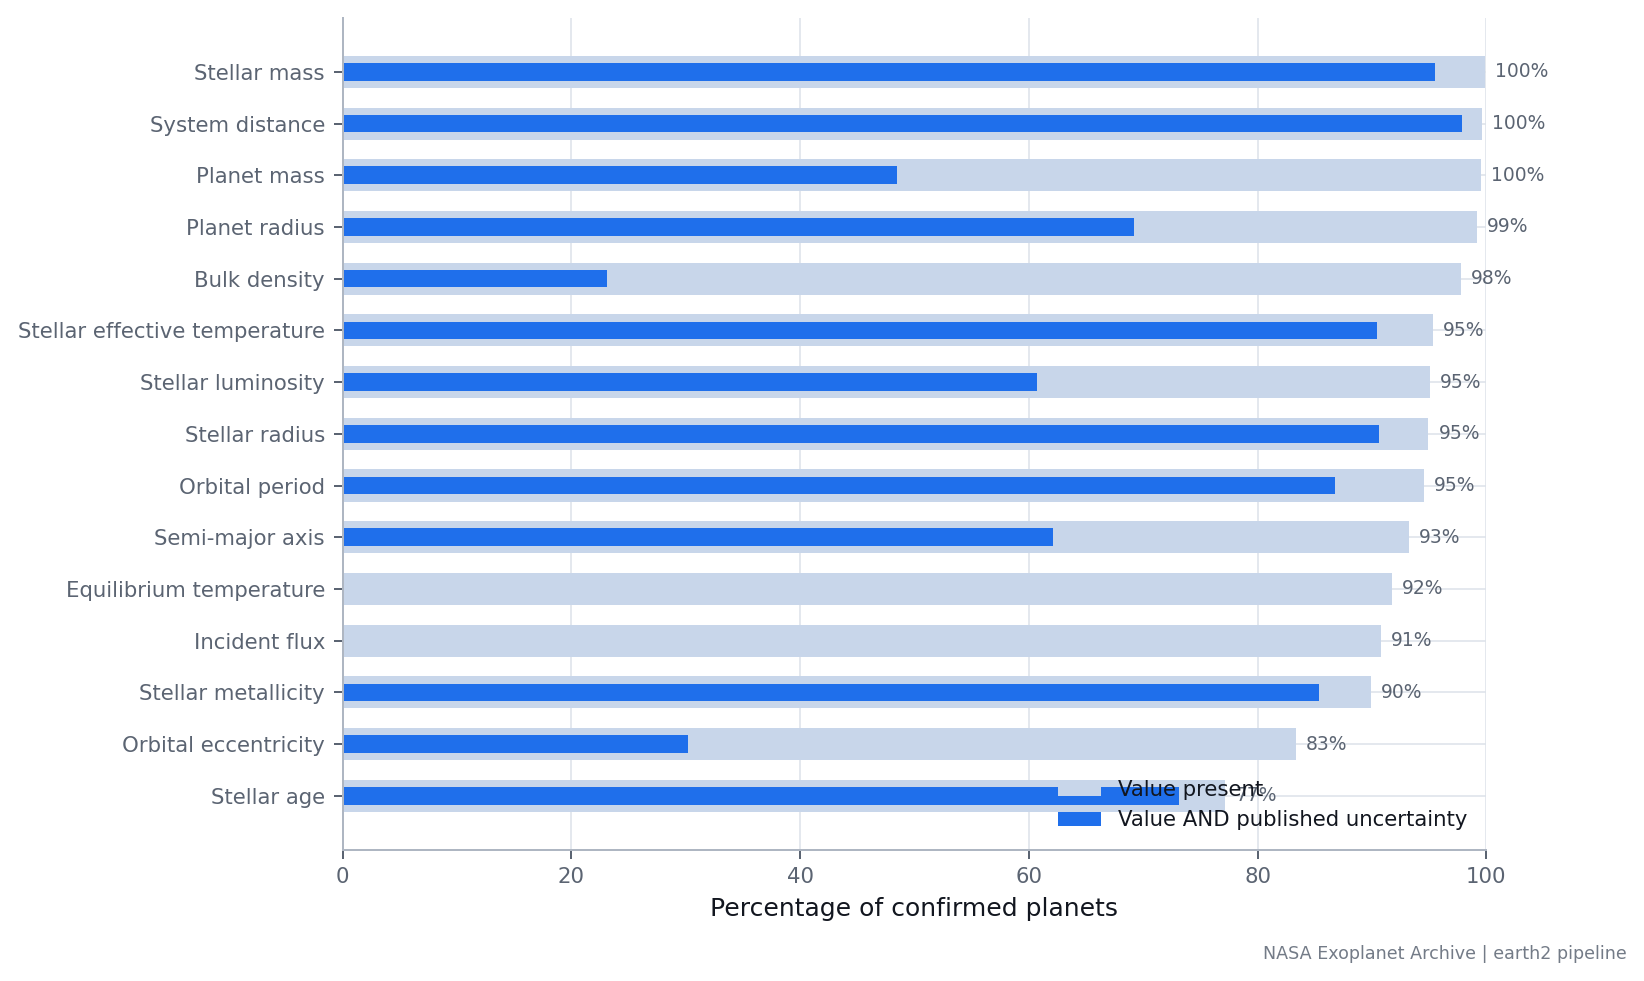
7. Crossmatching
Planets carry multiple survey identifiers — a TRAPPIST-1 planet is also a K2, EPIC, TIC, TOI, and Gaia DR3 object. We resolve these through the archive’s own alias-lookup service rather than string matching: “Kepler-442 b” and “Kepler-44 b” differ by one character and are different planets in different systems, so edit distance is never treated as evidence of identity. Every crossmatch records its method and confidence.
8. Habitable-zone model
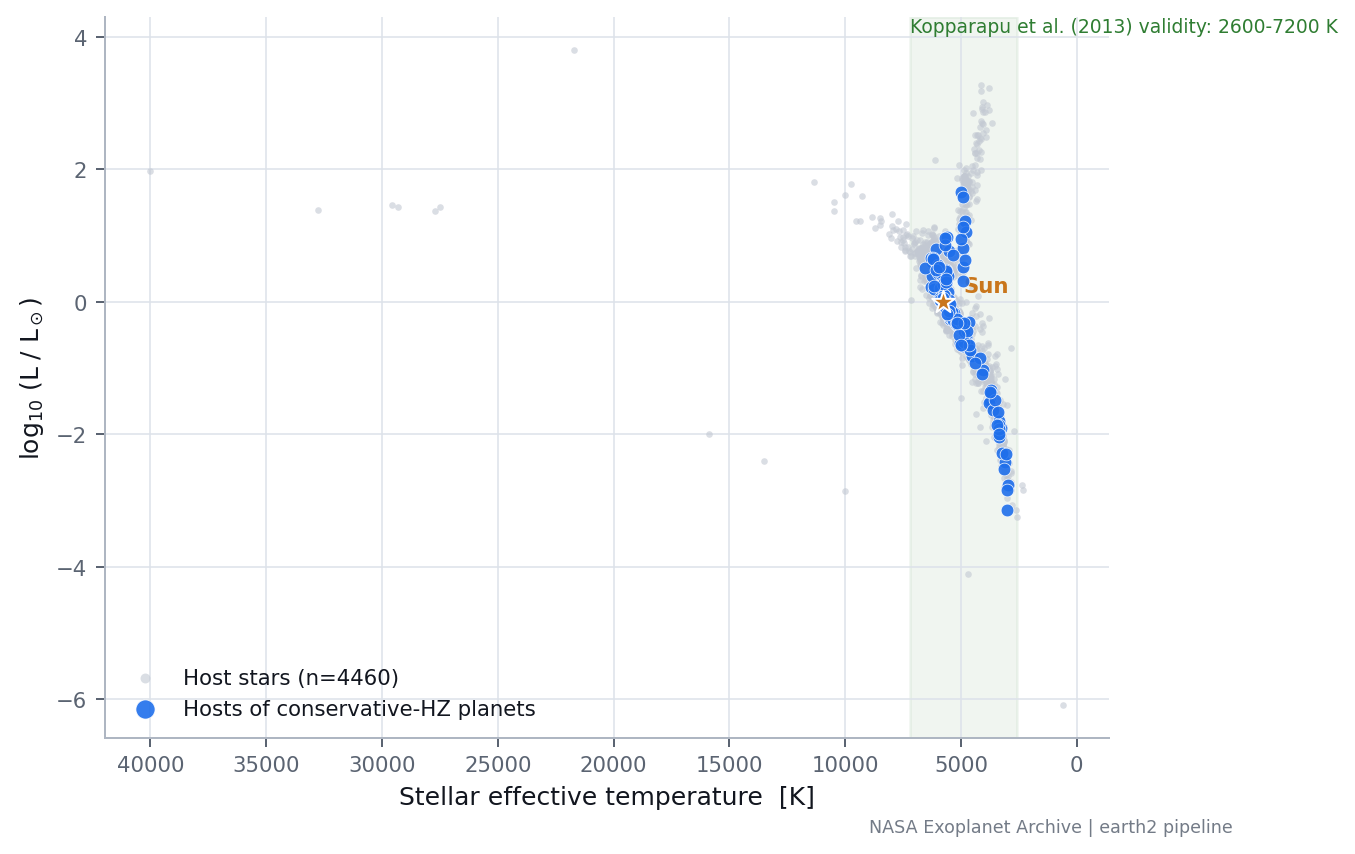
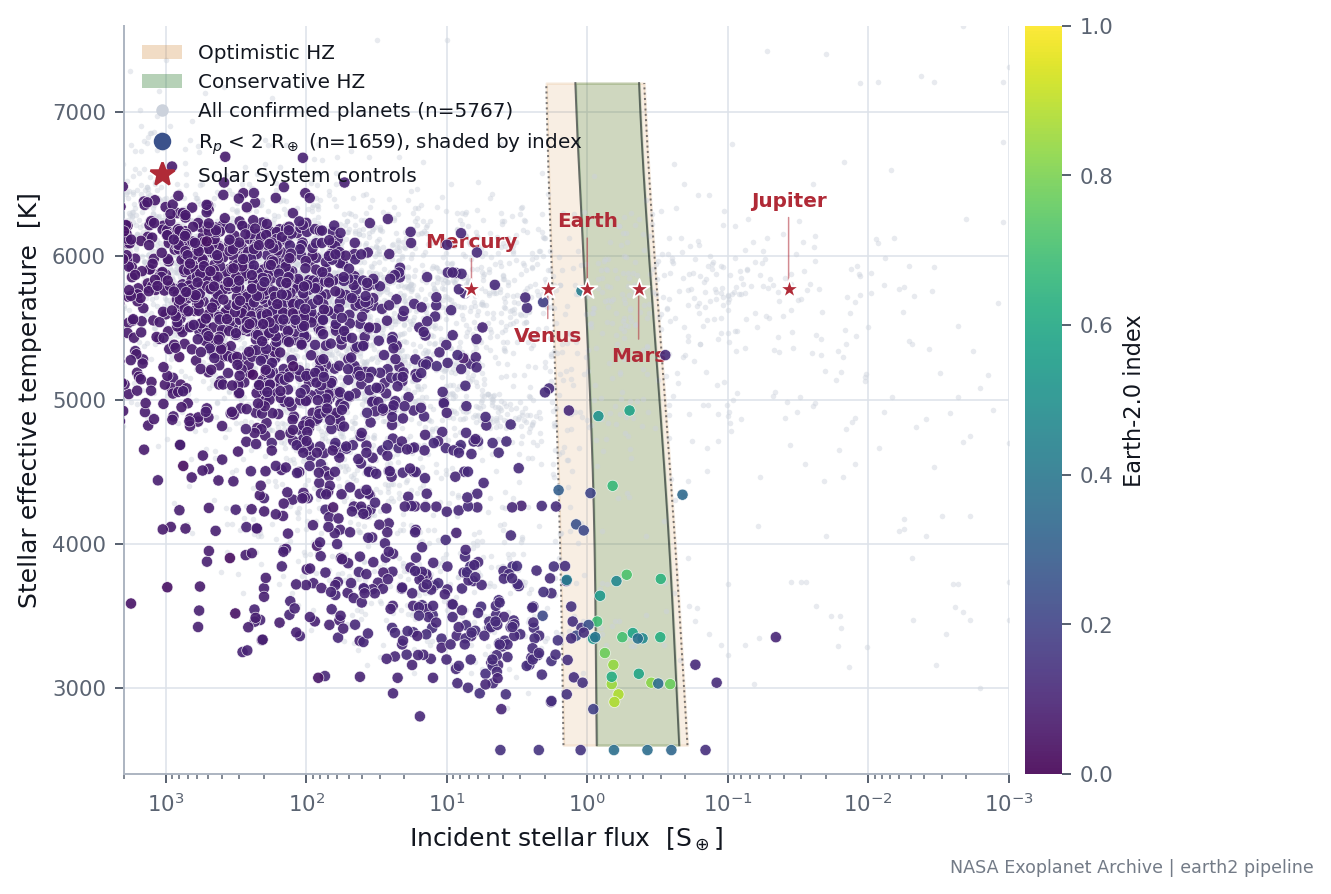
Habitable-zone boundaries follow Kopparapu et al. (2013), using the erratum coefficients (ApJ 770, 82) rather than the original Table 3, which the arXiv preprint still carries and which shifts the inner conservative boundary by over a percent in flux. We expose two zone definitions separately — conservative (runaway greenhouse to maximum greenhouse) and optimistic (recent Venus to early Mars) — because the disagreement between them is a genuine methodological uncertainty, not noise to be averaged away. Outside the fit’s stated 2600–7200 K validity range we return an explicit “model extrapolated” flag rather than silently clamping: TRAPPIST-1, at 2566 K, sits 34 K below the floor, and its habitable-zone status is reported both ways.
Methodological citation
9. Earth-similarity model
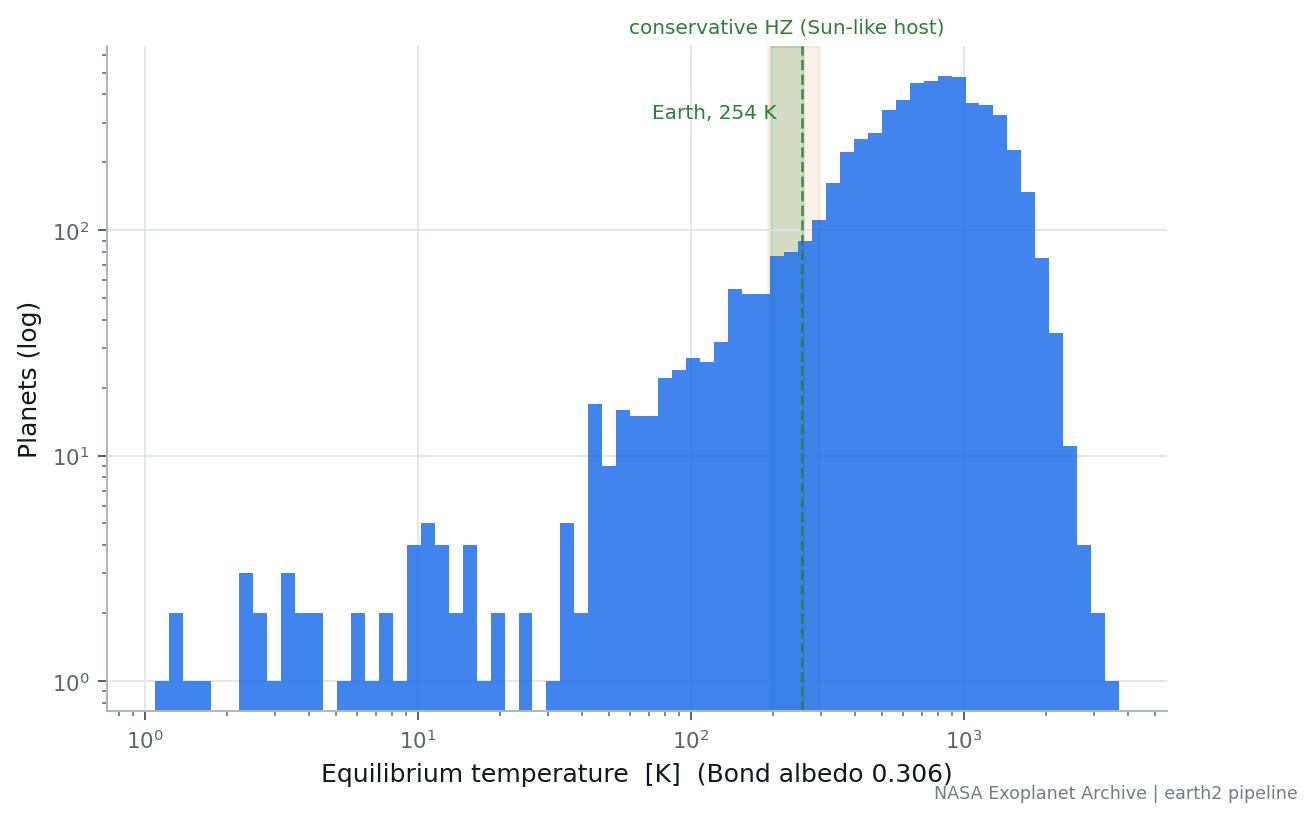
We compute the Schulze-Makuch et al. (2011) Earth Similarity Index from radius, bulk density, escape velocity, and equilibrium temperature. Because the paper’s temperature term is defined against Earth’s surface temperature (288 K) and exoplanet catalogues supply only equilibrium temperature (excluding greenhouse warming by construction), we reference against Earth’s own equilibrium temperature (254 K) instead — and we state the consequence rather than hide it: Venus scores 0.92 on this metric, because its high albedo makes its equilibrium temperature cooler than Earth’s. An Earth Similarity Index computed from data that actually exists for real exoplanets cannot distinguish an Earth from a Venus. This is a property of the observations, not a defect of this implementation, and Venus is carried through the whole pipeline as a control specifically so the degeneracy is visible in the results.
Methodological citation
10. Uncertainty propagation
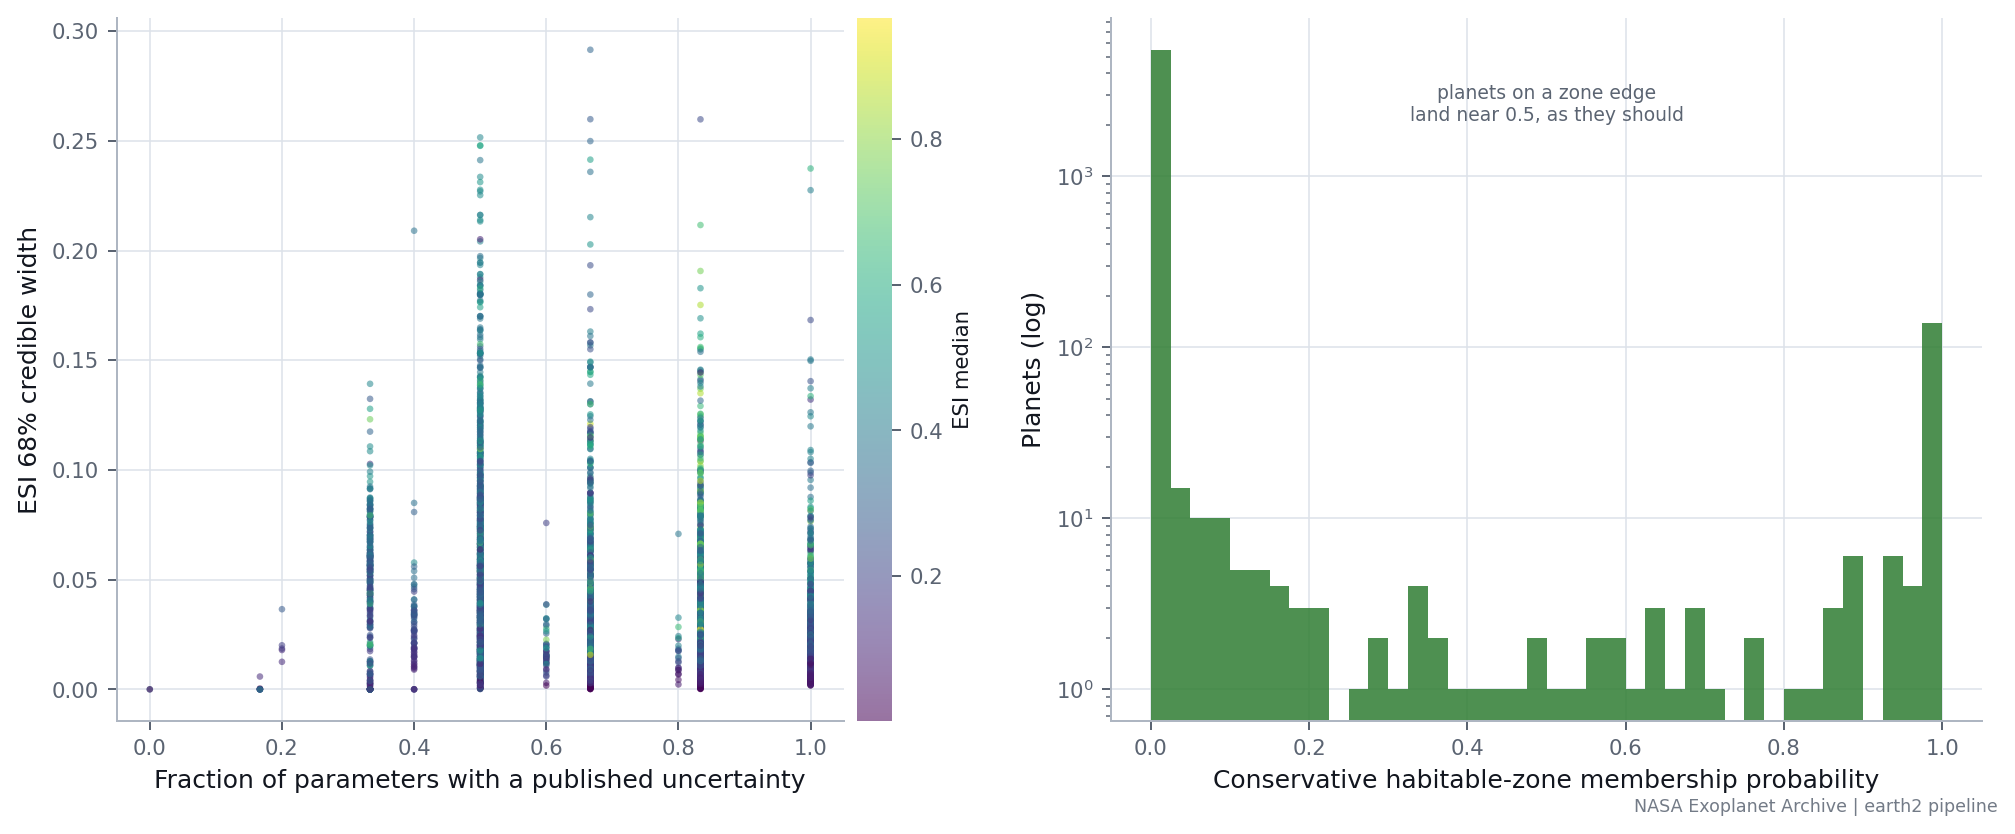
Every parameter with a published asymmetric uncertainty is sampled from a two-piece (split) normal distribution — 4,000 draws per planet, seed 20260824 — and every derived quantity is recomputed per draw. Missing uncertainties are sampled as a delta function and counted, not invented: the resulting artificially narrow posterior is tracked as mc_uncertainty_coverage and penalised explicitly by the observational-confidence score, so a planet that looks precisely Earth-like only because nobody published error bars cannot outrank one that is genuinely well measured.
Computational scale
11. Transit analysis
For planets with public MAST light curves, we detrend with a Savitzky–Golay filter (window forced to at least three times the transit duration), clip outliers upward only (a symmetric clip removes transits, which are downward excursions by definition), fold on the published ephemeris after converting it into the mission’s own time system, and fit a trapezoid. Every fit is checked against the published depth and rejected as unvalidated on disagreement beyond a factor of 1.6. Validated on four bright benchmark planets (HD 189733 b, WASP-39 b, HD 209458 b, WASP-19 b) at ratios of 0.77–0.99 to published depth. None of the current top-ranked Earth-2.0 candidates produces a validated fit — see Transit Lab.
12. Radial-velocity evidence
Public radial-velocity time series are retrieved from DACE together with the stellar activity indicators (log R’HK, H-alpha, Ca II H&K, CCF bisector span) measured from the same spectra. Every candidate period is checked against the periodograms of those indicators; a coincidence is flagged explicitly rather than silently accepted, because a rotating, spotted star produces an apparent velocity signal with no planet in it. A three-criterion reliability gate (minimum point count, amplitude significance, residual-to- amplitude ratio) blocks a fit from being reported as a measurement when the data cannot support it — a gate discovered to be necessary after an unconstrained fit on TRAPPIST-1 returned an apparent 10–41 Earth-mass planet where the true value is roughly one. See RV Lab.
13. Atmospheric spectroscopy
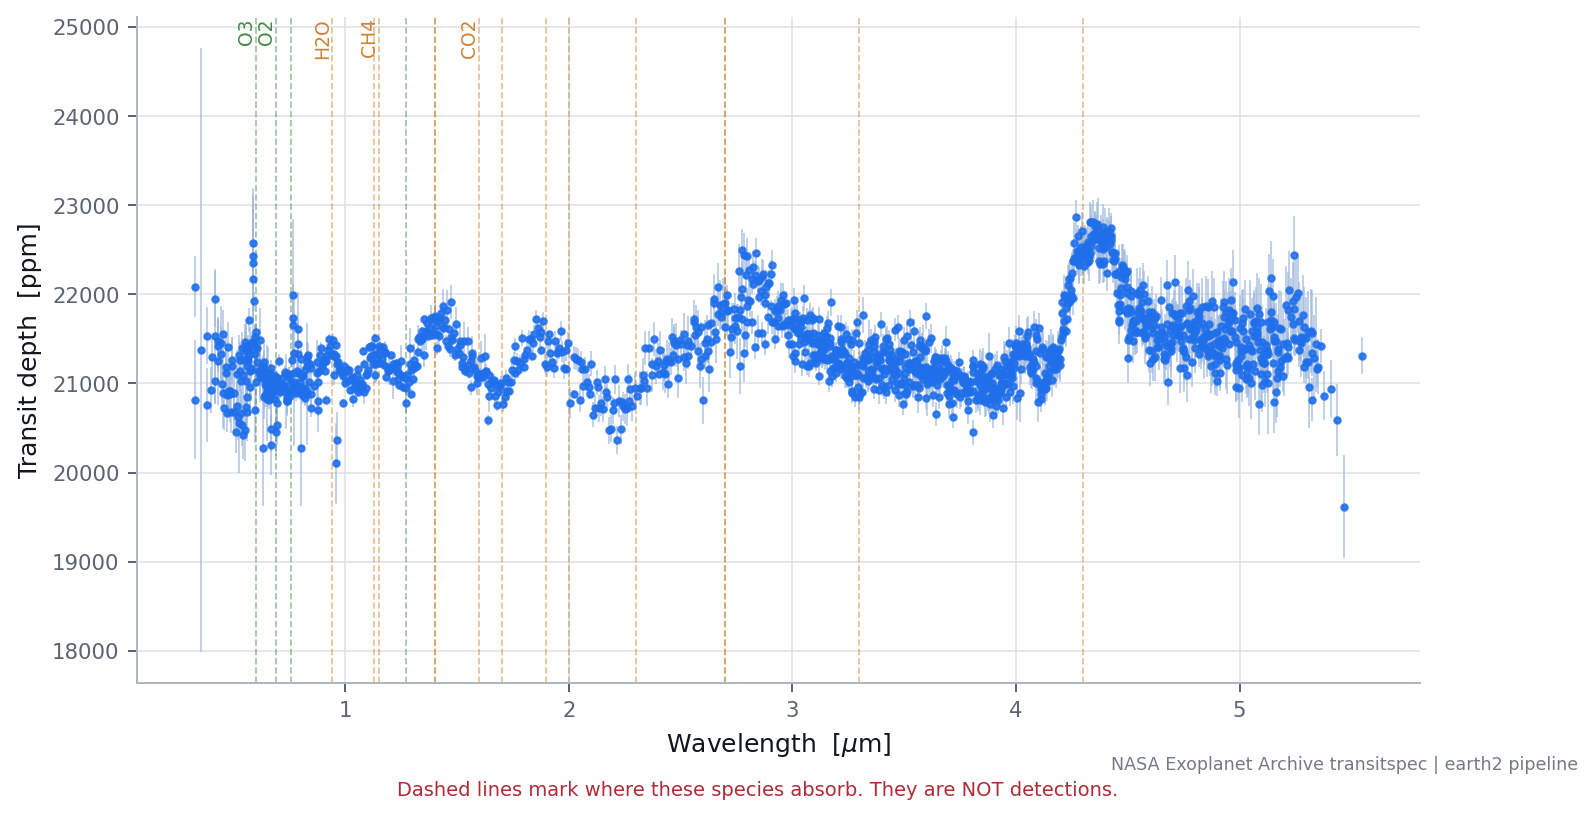
5,948 genuine transmission-spectroscopy measurements exist across 104 planets, harmonised from two incompatible archive representations (transit depth as a percentage, and planet-to-star radius ratio) into a single ppm scale. These are strictly planetary-atmosphere measurements — never conflated with the separate stellar-spectra holdings, which constrain the host star and underpin radial-velocity work but say nothing directly about a planet’s atmosphere. See Spectral Lab.
The instrument challenge
14. Biosignature context
We compute no probability of life for any planet, and no metric in this project is designed to approximate one. There is no calibrated likelihood function for biology on exoplanets: one confirmed inhabited world, no confirmed uninhabited control with a directly comparable atmosphere, and an incomplete theory of abiotic false positives. Instead we document, per species, the documented abiotic production routes — water photolysis with hydrogen escape, CO₂ photolysis, serpentinisation — and the conditions (disequilibrium rather than a single gas, a characterised stellar UV environment, reported cloud and retrieval degeneracies, independent reproduction) that would need to hold before a biological interpretation could be taken seriously.
15. Candidate ranking
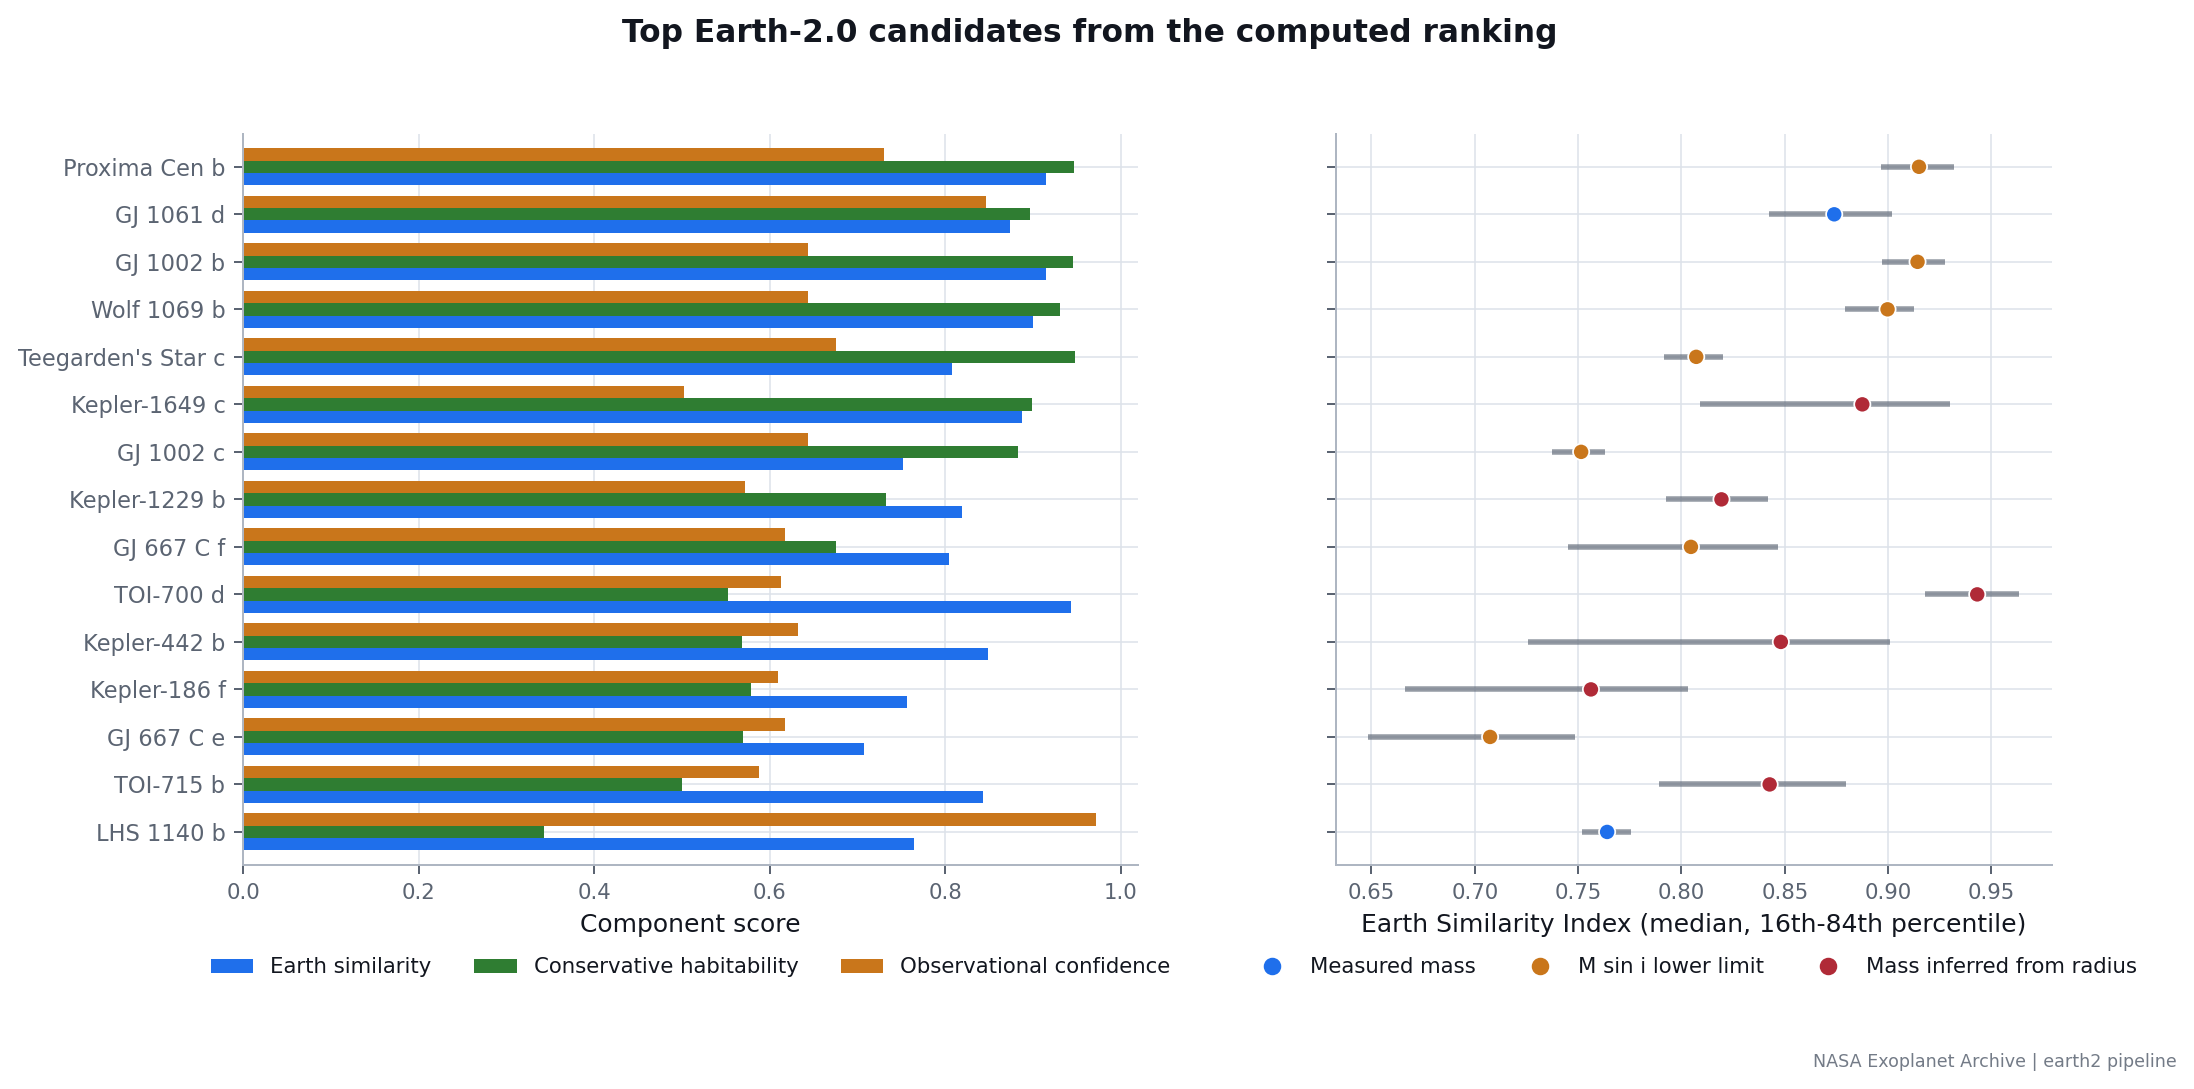
Four independent, interpretable scores — Earth similarity, conservative habitability, observational confidence, and characterisation potential — combine into a composite Earth-2.0 index by a weighted geometric mean, not an average. This choice is deliberate: under an arithmetic mean, an ultra-hot Jupiter with excellent measurements and strong observability would score respectably despite zero habitability, its strong components compensating for the disqualifying one. A geometric mean is non-compensatory. Weights are exposed and reader-adjustable on the Ranking page; the pipeline default weighting is 35% similarity, 40% habitability, 25% confidence, and 0% characterisation potential (excluded because it structurally penalises non-transiting planets such as Proxima Centauri b for a reason unrelated to habitability).
16. How this compares to existing habitability catalogues
The weighted geometric mean above is not a new idea. The Statistical-likelihood Exo-Planetary Habitability Index (SEPHI; Rodríguez-Mozos & Moya 2017, MNRAS 471, 4628) already combines four physical sub-likelihoods the same multiplicative way, propagating Monte Carlo uncertainty (up to 10,000 realisations) through the calculation — but reports it as a single symmetric error bar around the final score. The Planetary Habitability Laboratory’s Habitable Exoplanets Catalog similarly reports several independent metrics side by side (the Earth Similarity Index, Habitable Zone Distance, and Global Primary Habitability) without collapsing them into one number, but none of the three is itself a measurement-confidence term.
What we did not find in the published methodology of either tool — nor in a search of the broader 2015–2026 literature on composite habitability indices — is measurement confidence combined into the composite as a peer axis, rather than reported only as an error bar wrapped around a purely physical score. SEPHI’s four sub-likelihoods (surface, escape velocity, atmosphere, thermal) all describe the planet’s physical state; none of them represents how well that state is actually known. Here, observational confidence — the fraction of Monte Carlo draws for which the habitable-zone model is even valid for the host star’s temperature, and whether mass is dynamically measured or inferred from a mass–radius relation — carries its own weight in the same product that determines the composite index, so a planet that looks Earth-like on paper but is poorly measured cannot simply outrank one that is measured well. This is a difference in what goes into the combination, not a claim to have invented non-compensatory scoring, which SEPHI already uses.
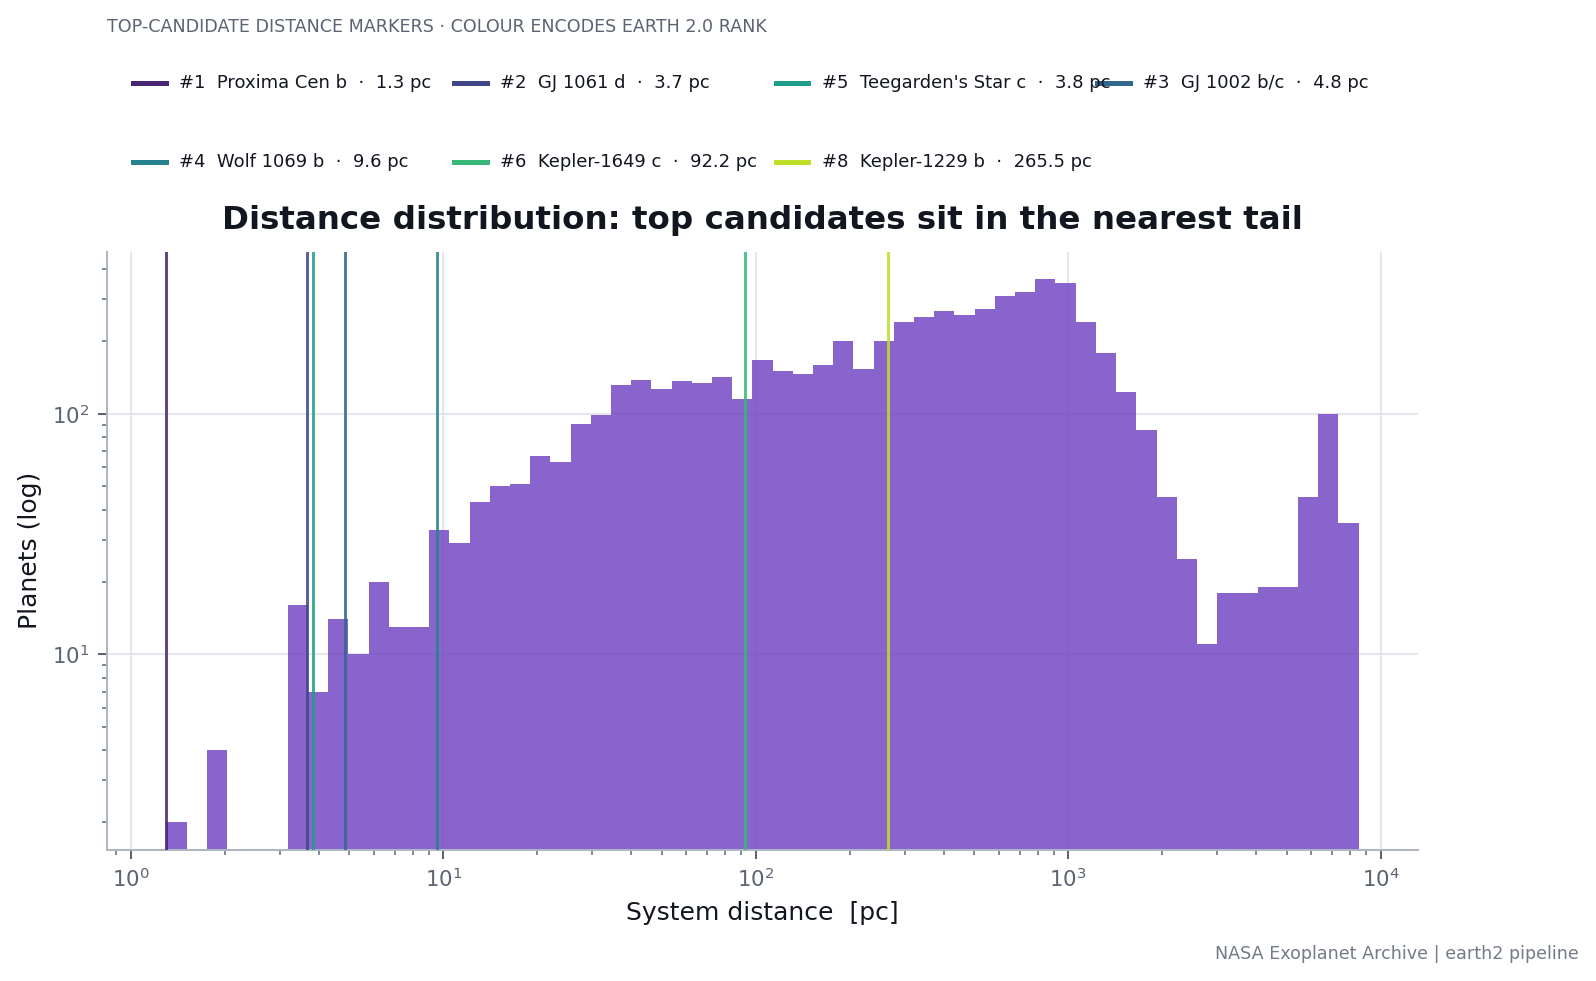
Three smaller, more specific things we looked for and could not find precedent for: (1) a public catalogue that explicitly computes and displays both a strict reading (excluded) and a labelled extrapolated reading for a host star below the Kopparapu et al. (2013) model’s calibrated 2600 K floor — TRAPPIST-1 at 2566 K being the clearest case — rather than silently extrapolating or silently excluding; (2) an empirical “how far has each detection method actually reached” statistic, computed as the real maximum confirmed-detection distance per method in a live catalogue, as distinct from a theoretical instrument-sensitivity claim (see the Galaxy page); and (3) the specific combination of archive-manifest source tracking (a SHA-256 of every retrieved payload), continuous-integration checks that re-execute every reproducibility notebook on each push, and a click-to-trace interface connecting a displayed number back to its originating archive query, applied together on a public-facing habitability catalogue.
Gaia DR3 cross-matching by exact source_id and RUWE-based unresolved-binary flagging (Section 7) is not claimed as original — it is now standard practice in the professional literature for characterising exoplanet host stars (e.g. Gaia DR3 detectability of unresolved binary systems, A&A 2024), and is used here for exactly that reason: it is the established way to catch a false positive from an unresolved companion, not a novel technique of ours.
16.1 A selection-aware map of discovery
A three-dimensional planet browser is useful, but it is not by itself a research contribution: NASA’s Eyes on Exoplanets already provides a scientifically accurate 3-D catalogue explorer. The distinct question here is temporal and methodological: how did the observed Galactic sample acquire its present shape? The interactive Universe view therefore animates discovery year, while retaining filters for distance and detection method. It is an animation of the archive record, not of stellar motion.
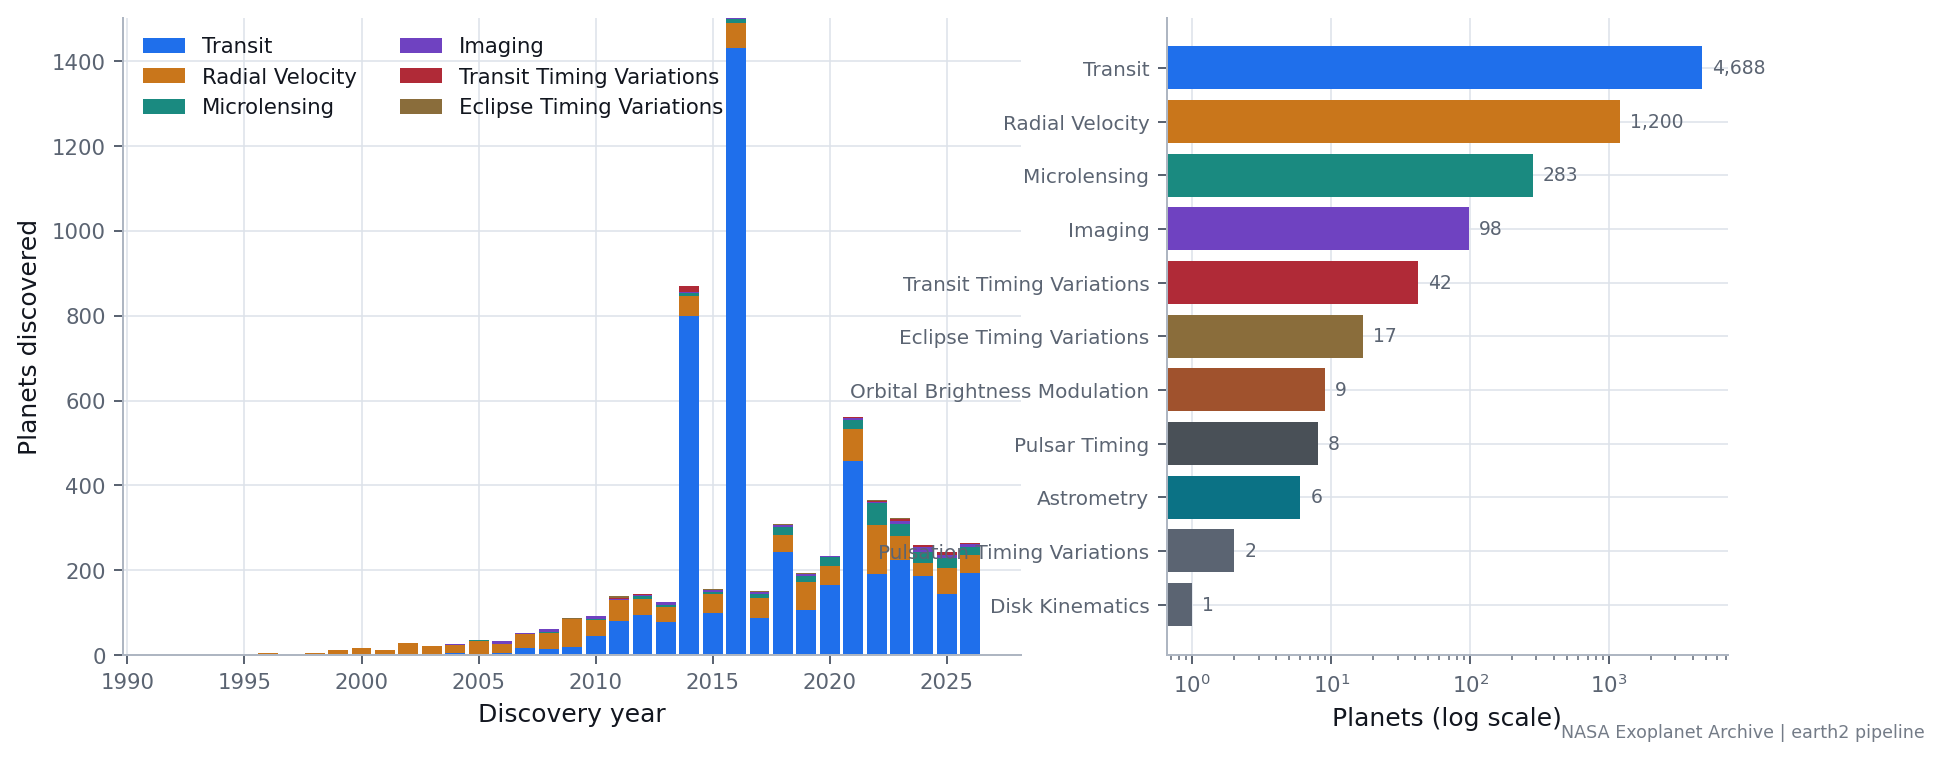
That distinction is scientifically necessary. Confirmed-planet positions are not an occurrence map. Transit surveys, radial-velocity programmes, microlensing campaigns, and direct-imaging searches observe different targets, sky areas, periods, contrasts, and host-star populations. In Kepler-plus-Gaia work, spatial gradients visible before correction largely disappear after the survey bias is modelled (Maliuk & Budaj 2020, A&A 635, A191). More generally, inference from exoplanet catalogues must account for censoring by non-trivial selection effects and detection efficiencies (Foreman-Mackey, Hogg & Morton 2014, ApJ 795, 64). The Galaxy page therefore reports empirical reach and sky concentration by method, and explicitly warns that a dense region records where a survey looked and what it could detect—not necessarily where planets are intrinsically more common.
Research claim
17. Deep-dive systems
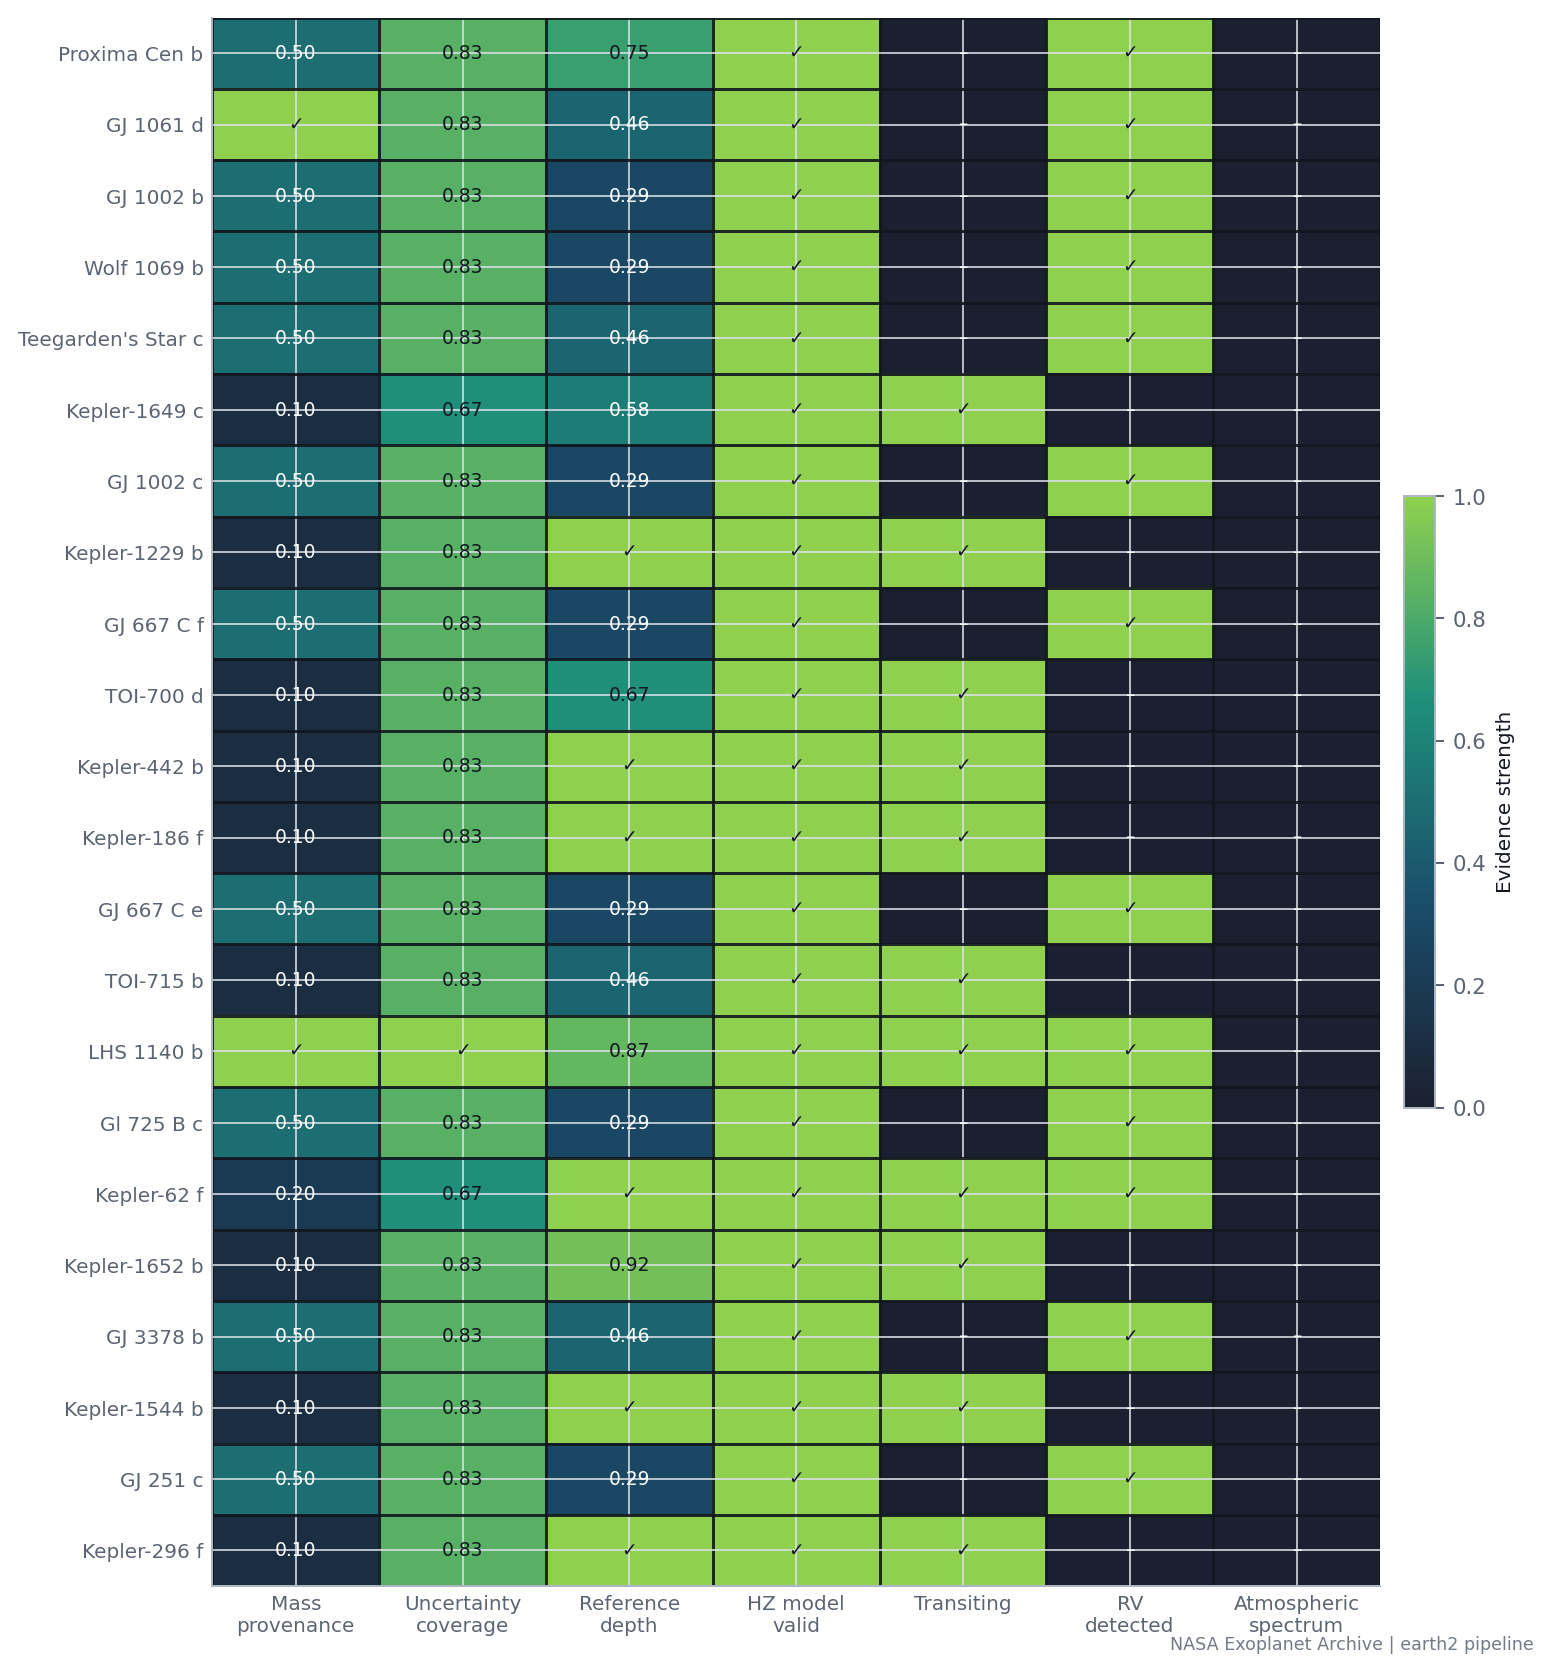
The ten highest-ranked candidates are selected purely from the computed index, never hand-picked, and receive full deep-dive treatment: every parameter with its uncertainty and per-measurement source link, Monte Carlo posteriors, host-star and sibling-planet context, an attempted transit fit and an attempted radial-velocity analysis where public data exists, and an explicit statement of which analyses werenot possible and why. Earth, Venus, Mars, Mercury and Jupiter run through the identical pipeline as labelled comparison controls.
18. Results
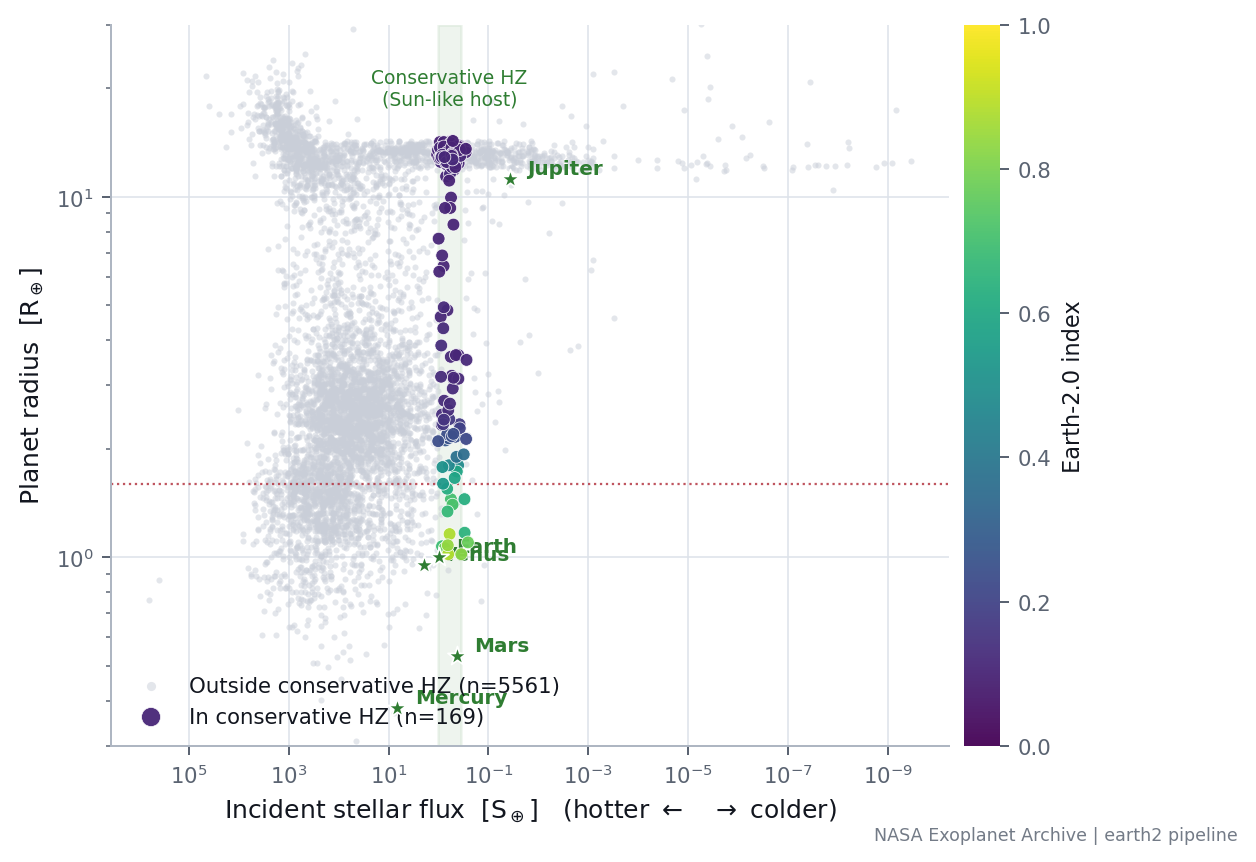
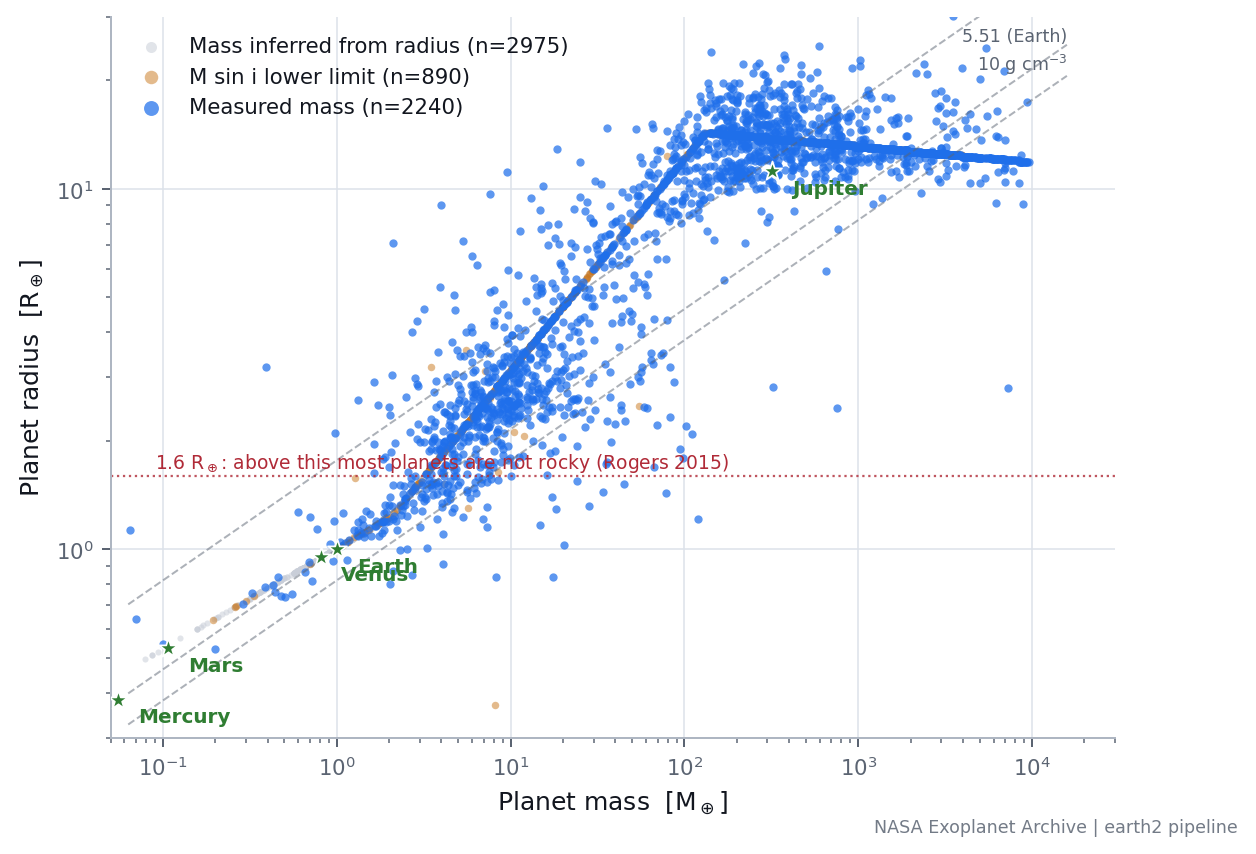
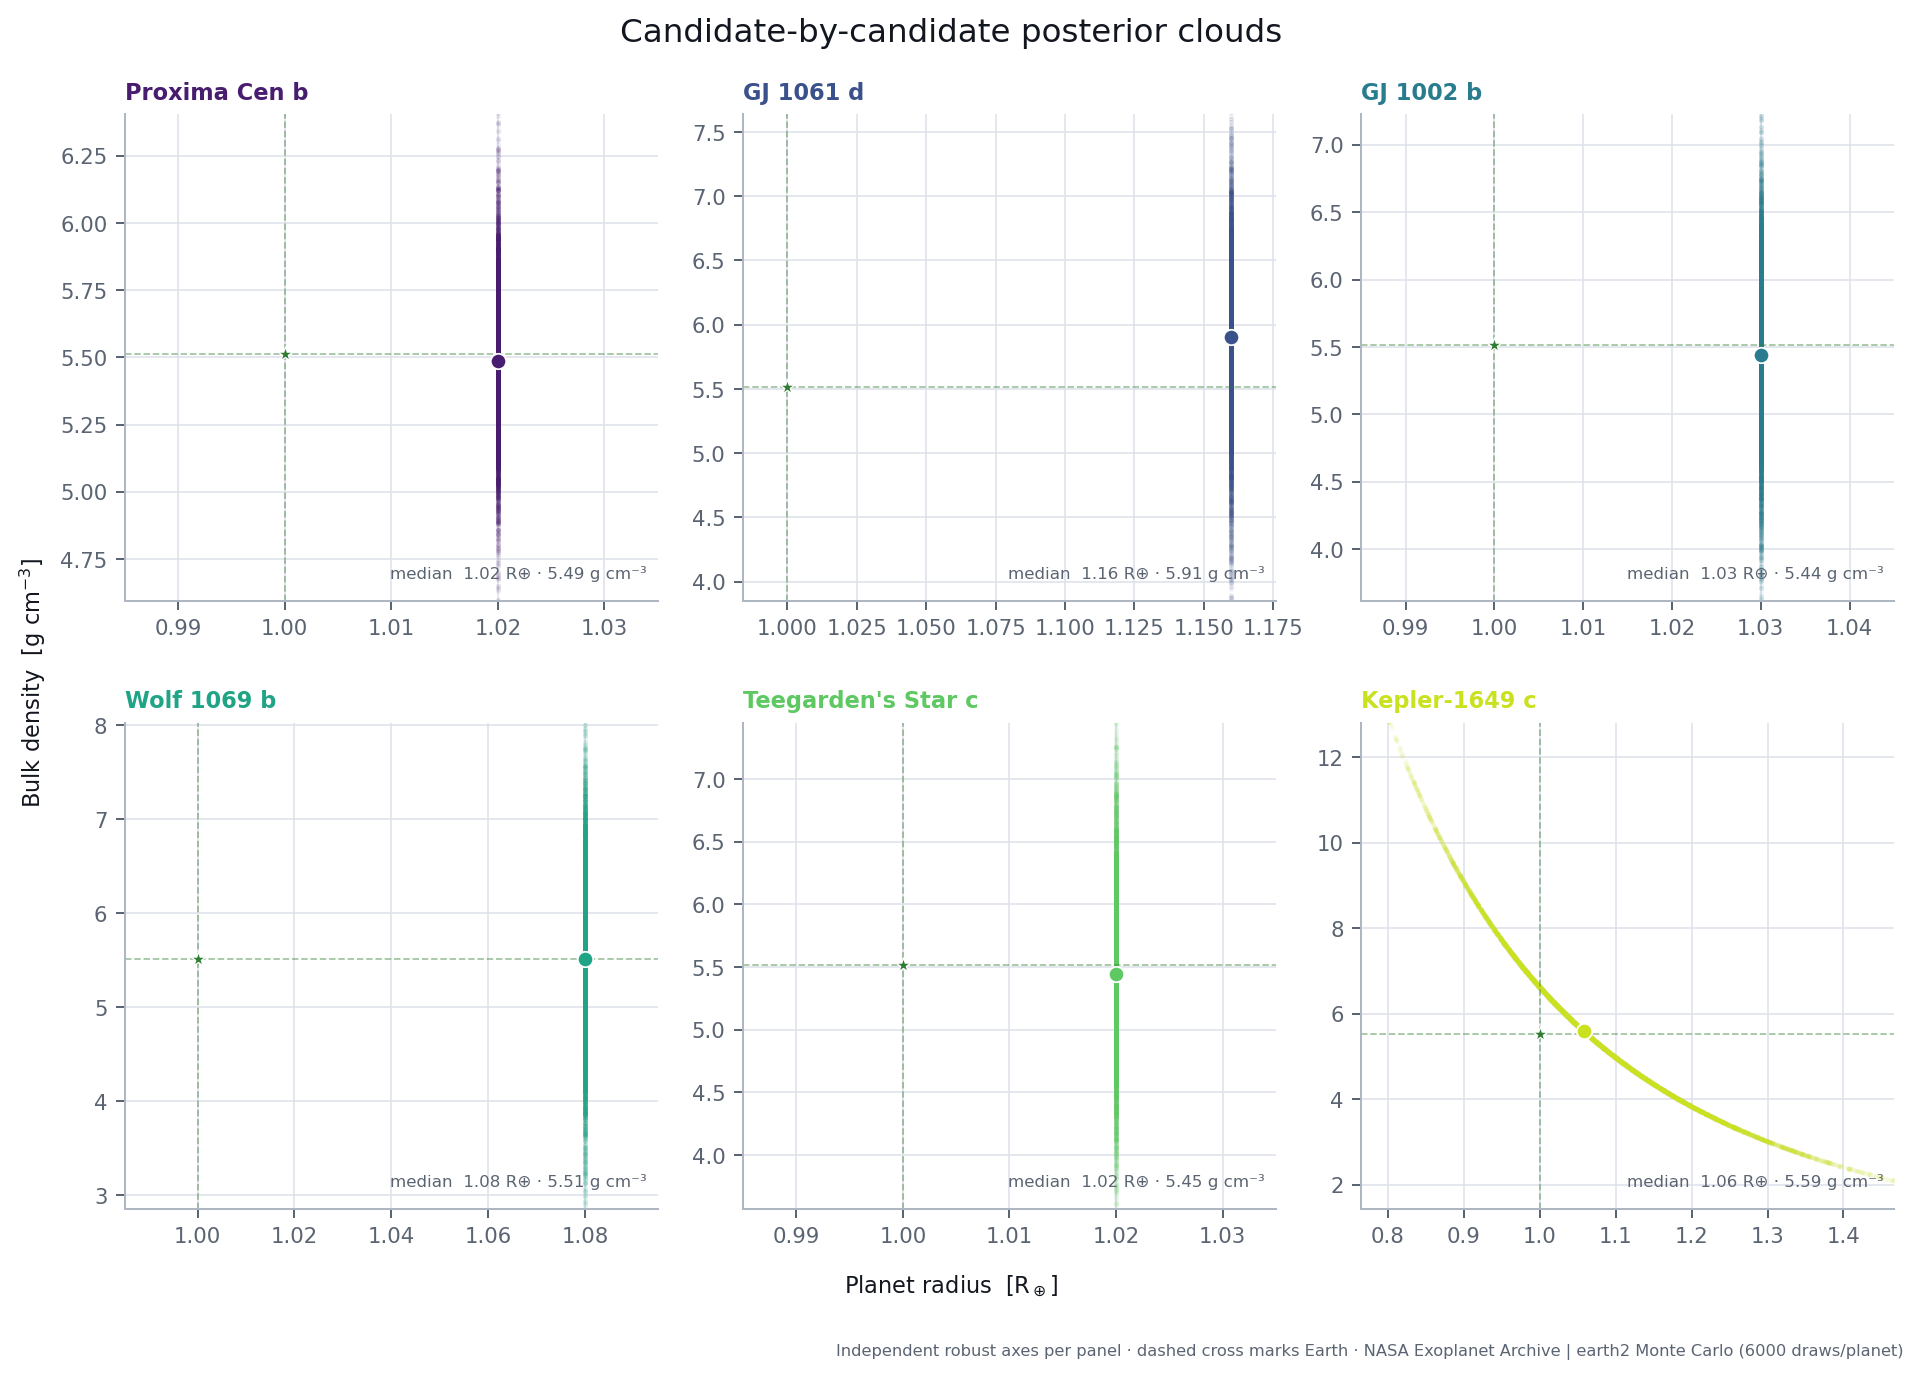
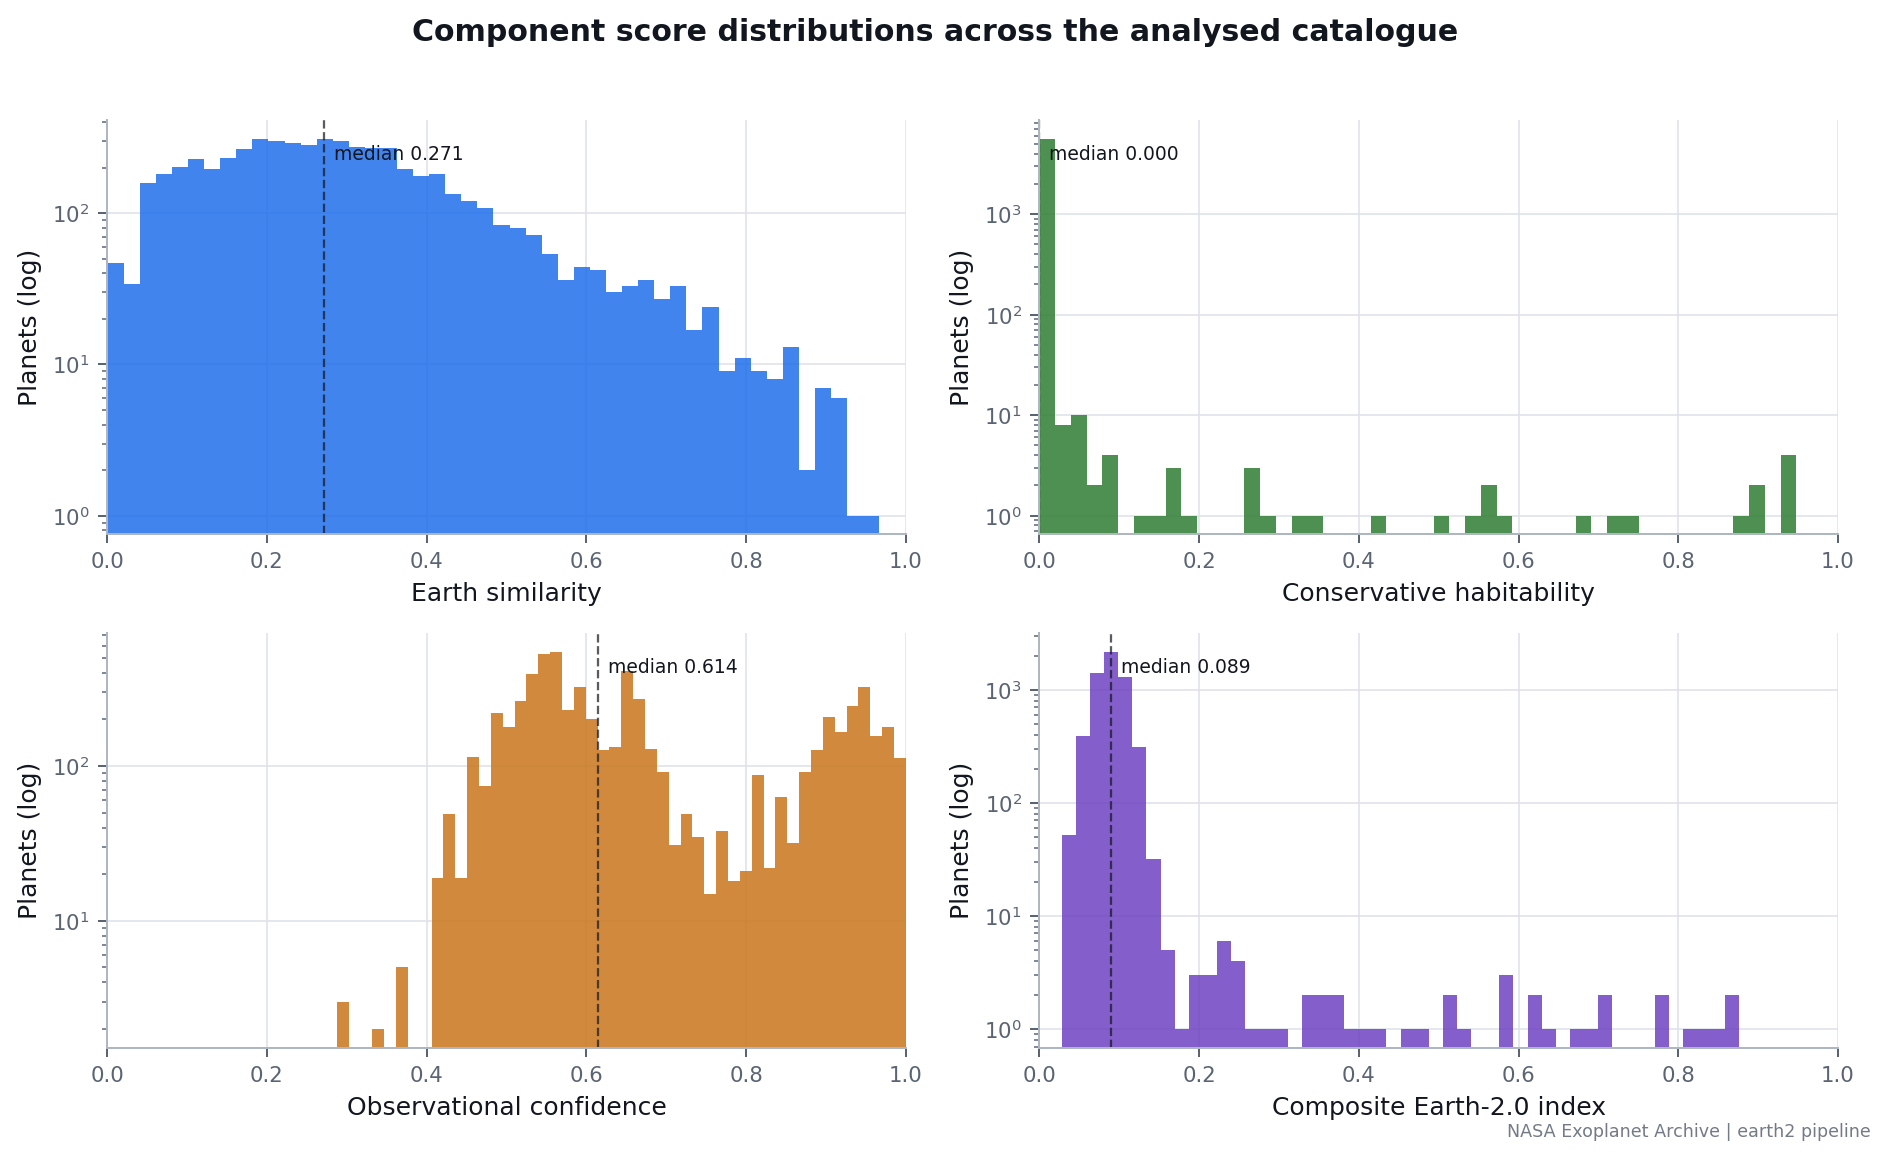
Of 6,354 confirmed planets, 2,240 (35%) have a directly measured mass; 2,975 (47%) carry a mass predicted from the radius by a mass–radius relation and therefore add no independent information to density or escape velocity. 174 planets fall in the conservative habitable zone under the strict (non-extrapolated) model evaluation; 279 under the optimistic definition. Intersecting habitable-zone membership with rocky plausibility (radius below 1.6 R⊕) narrows this to 15 planets, of which 1 has a measured mass. The computed top of the ranking — Proxima Centauri b, GJ 1061 d, GJ 1002 b, Wolf 1069 b, Teegarden’s Star c, and GJ 1002 c — independently recovers nearby M-dwarf terrestrial systems the literature already treats among the leading temperate candidates, which we take as evidence the underlying physics is implemented correctly rather than as a novel discovery. TRAPPIST-1’s planets, prominent in earlier runs of this pipeline, no longer lead the ranking: their host star’s effective temperature (2566 K) sits below the habitable-zone model’s calibrated floor, so the conservative-habitability score is discounted by the small fraction of the Monte Carlo posterior the model could actually evaluate, rather than reporting a confident-looking probability computed from only that minority of draws (see Limitations).
19. Observational biases
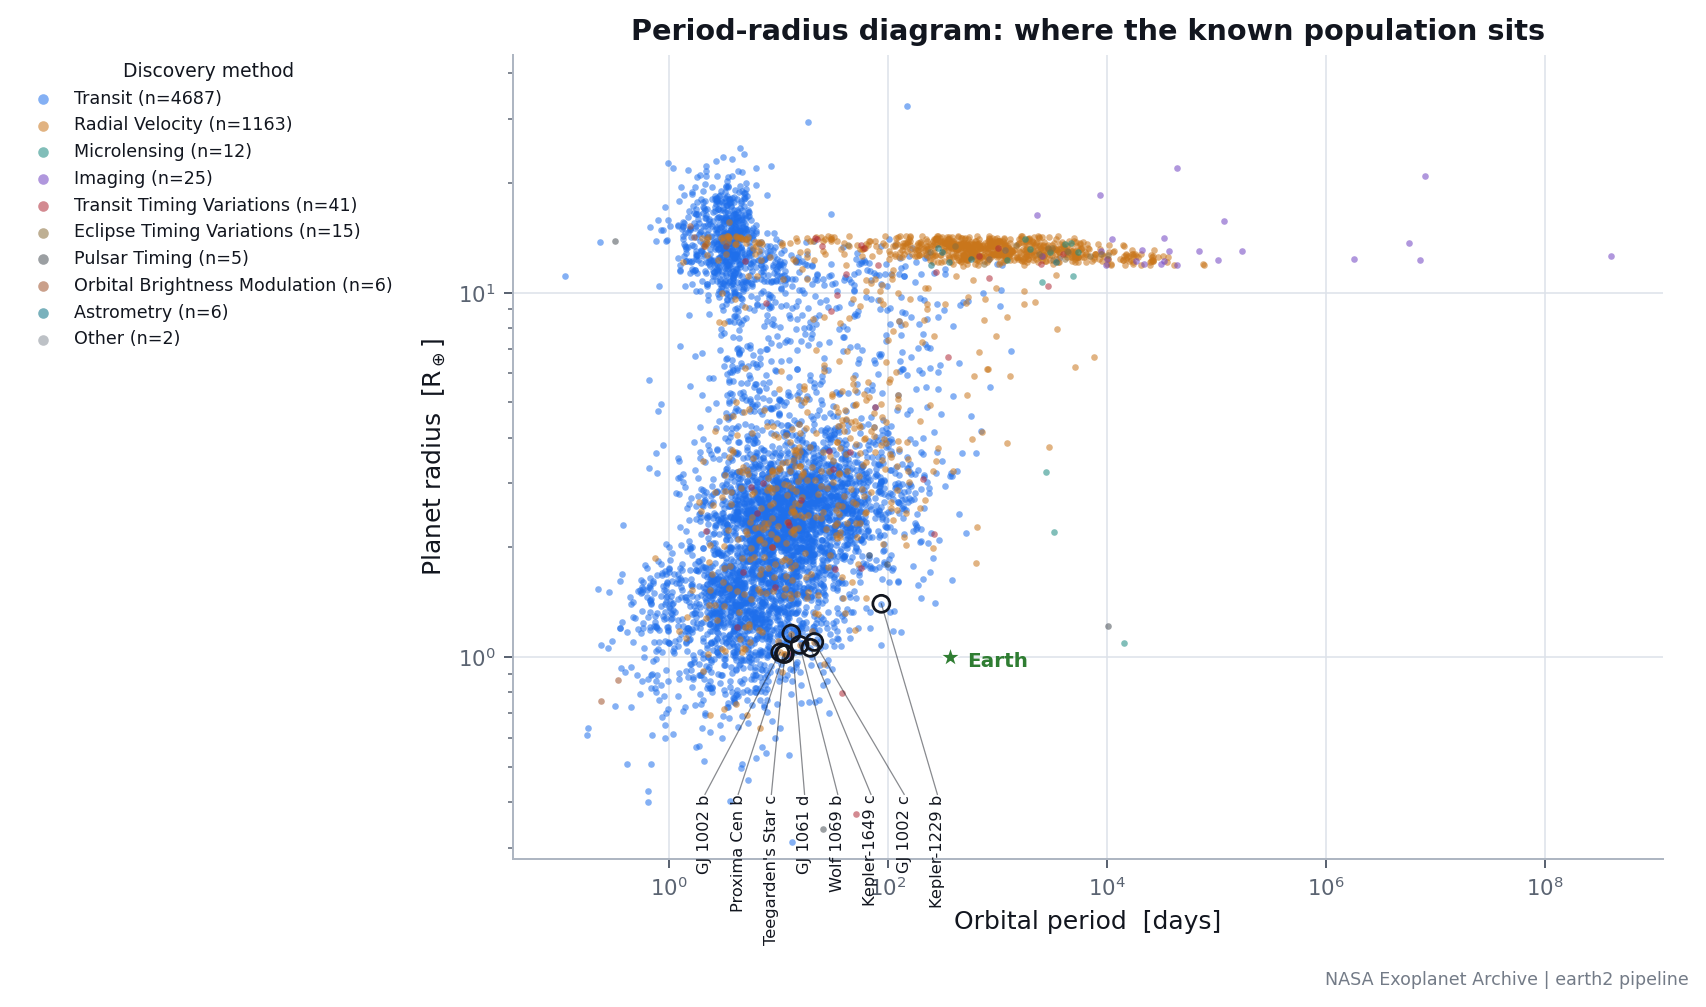
The discovery-method distribution in this catalogue is the shape of our instruments, not the true underlying planet population. Transit surveys favour short orbital periods and large planet-to-star radius ratios; radial-velocity surveys favour massive planets on close orbits around bright, quiet stars; direct imaging favours young, wide- separation giant planets. A temperate Earth-mass planet around a Sun-like star is disfavoured by every major detection method simultaneously — its transit probability is low, its RV amplitude is roughly 9 cm/s, and it sits far too close to its host for imaging. The preponderance of small-star candidates in this ranking is therefore partly a statement about M dwarfs being easier to search, not only a statement about where temperate rocky planets exist.
The catalogue is a survey artefact
20. Limitations
The full accounting is in Limitations. The four load-bearing ones: the Earth Similarity Index cannot separate Earth from Venus given the data that exists; roughly half of catalogue masses were never measured; the habitable-zone model does not formally cover the TRAPPIST-1 host temperature; and an Earth twin’s atmospheric transmission signal (about 1 ppm) is roughly an order of magnitude below demonstrated JWST precision, so finding an Earth analogue and characterising its atmosphere are separated by a generation of instruments.
21. Future observations
Follow-up is split into independent observing lanes. For transiting candidates, the Kempton et al. (2018) Transmission and Emission Spectroscopy Metrics indicate relative atmospheric-characterisation feasibility, while propagation of the published period and midpoint errors reports the predicted transit-time uncertainty at 2030-01-01 (with a separate warning for transit-timing variations). The radial-velocity lane reports expected semi-amplitude, frequently below 1 m/s for temperate small planets. The reflected-light lane reports nominal maximum angular separation and a quadrature contrast scenario assuming geometric albedo 0.30 and a Lambert phase function. None is called a detection limit, and none enters the default Earth-2.0 index.
22. Conclusions
The search for Earth 2.0 is not currently constrained by the number of known exoplanets. It is constrained by how few of them are measured well enough to support the claim. A physically grounded, uncertainty- aware, and evidentially honest ranking surfaces a short, specific list of candidates worth prioritising for further observation, while making the boundary between what is known and what is merely plausible explicit at every step.
23. References
The full bibliography, with per-measurement links back to 1,814 distinct publications drawn from the archive’s own reference metadata, is on the References page. Key methodological citations: Kopparapu et al. (2013, ApJ 765, 131, with the 2013 erratum ApJ 770, 82); Schulze-Makuch et al. (2011, Astrobiology 11, 1041); Rogers (2015, ApJ 801, 41); Fulton et al. (2017, AJ 154, 109); Kempton et al. (2018, PASP 130, 114401); Rodríguez-Mozos & Moya (2017, MNRAS 471, 4628).