Exoplanet Atmosphere Report · JWST NIRCam
HD 189733 b
Famous as the "blue planet" — its deep azure color, inferred from scattered starlight rather than a true photograph, is attributed to high-altitude scattering haze, though the exact particle composition (silicates are one candidate among several) isn't pinned down. One of the most intensively studied hot Jupiters, this page runs a simple two-window band-contrast statistic on its JWST NIRCam transmission spectrum and reports it next to the retrieval-based molecular significances Fu et al. (2024) actually publish.
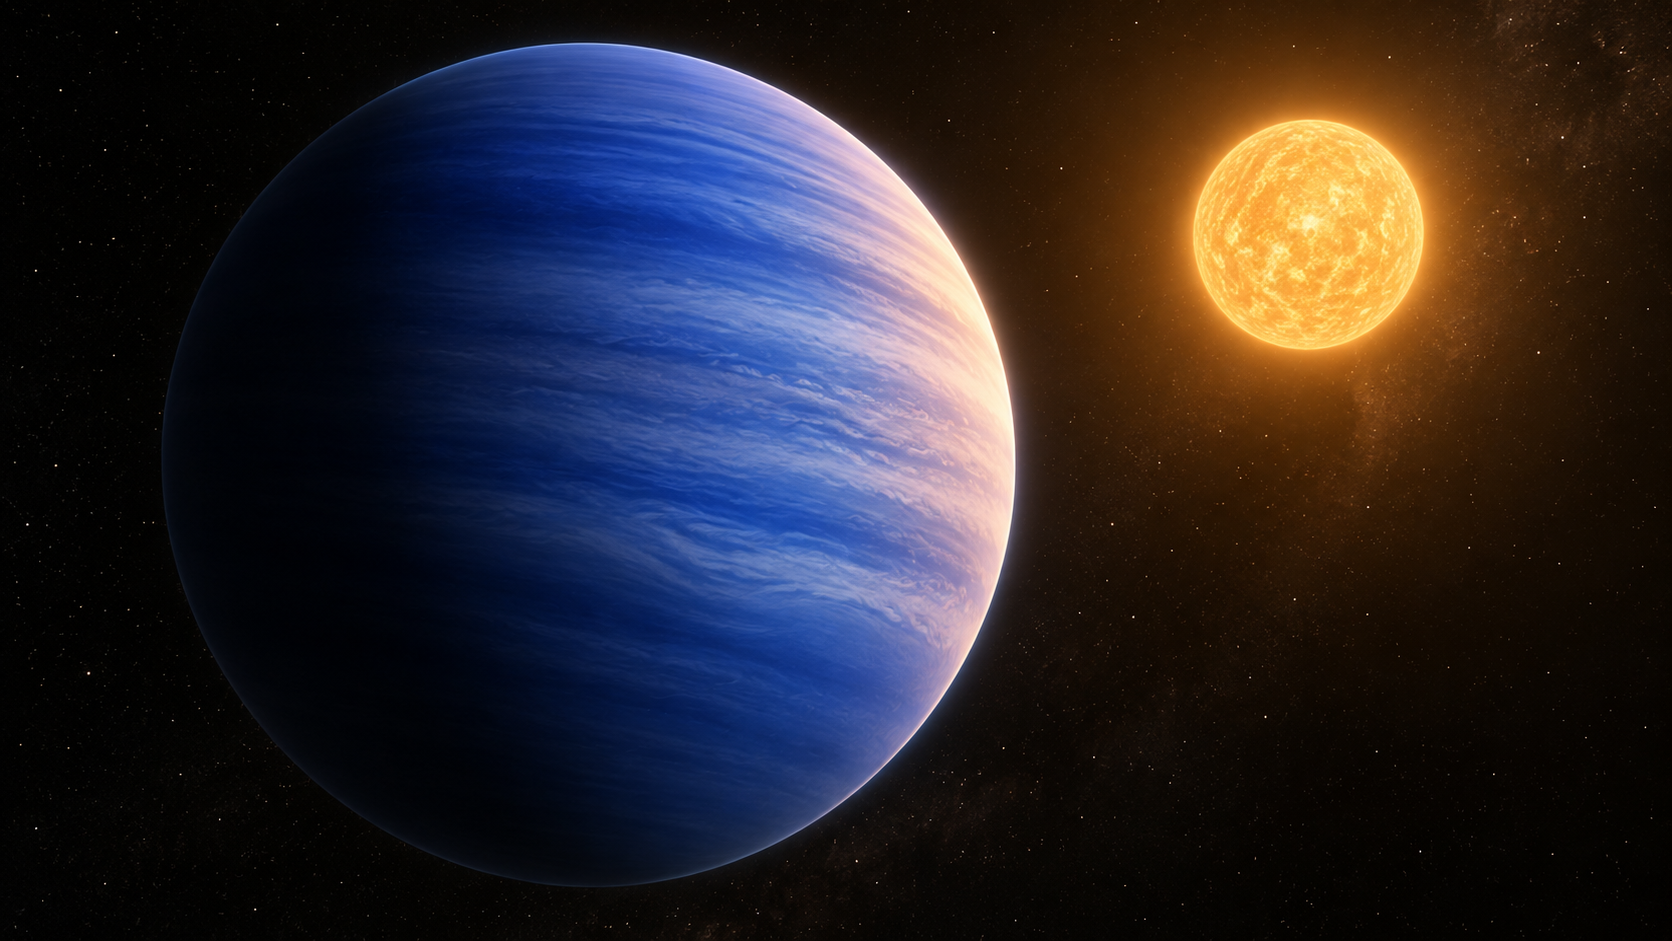
AI-generated artist's concept of HD 189733 b — not a real photograph. All data and figures in this report come from actual JWST NIRCam observations (see below).
The planet, in numbers
Queried live from the NASA Exoplanet Archive TAP service (pscomppars).
| Radius | 12.67 Earth radii (~1.13 Jupiter radii) |
|---|---|
| Mass | 359.1 Earth masses (~1.13 Jupiter masses) |
| Orbital period | 2.22 days |
| Semi-major axis | 0.0313 AU |
| Equilibrium temperature | 1209 K |
| Host star | HD 189733, K-type dwarf, Teff = 5052 K, 0.75 Rsun, 0.79 Msun |
| Distance | 19.8 parsecs (~64.5 light-years) |
| Discovery | 2005, radial velocity, transit confirmed shortly after |
A hot Jupiter studied longer than almost any other
HD 189733 b's brightness and proximity (under 65 light-years away) have made it one of the single most observed exoplanets since its 2005 discovery: it hosts the first exoplanet weather map (Knutson et al., 2007), the first detection of scattered-light Rayleigh haze that gave rise to its "blue planet" reputation (Pont et al., 2013; the color itself was inferred, not directly imaged), and now, with JWST, some of the highest-precision transmission spectra obtained for any exoplanet.
The data behind this report comes from a JWST NIRCam study reporting a metal-enriched atmosphere with a detection of hydrogen sulfide (H2S) — a molecule rarely confirmed in an exoplanet atmosphere — alongside water and carbon dioxide.
AI-generated 3D-render-style concept of the planet's deep-blue haze layer — not an actual image of the planet.
Band contrast, and what the paper actually measured
The figure is generated directly from the reduced NIRCam spectrum. Two wavelength windows are compared against a nearby continuum window — a quick way to see where the spectrum has structure, but not the same thing as identifying which molecule is responsible.
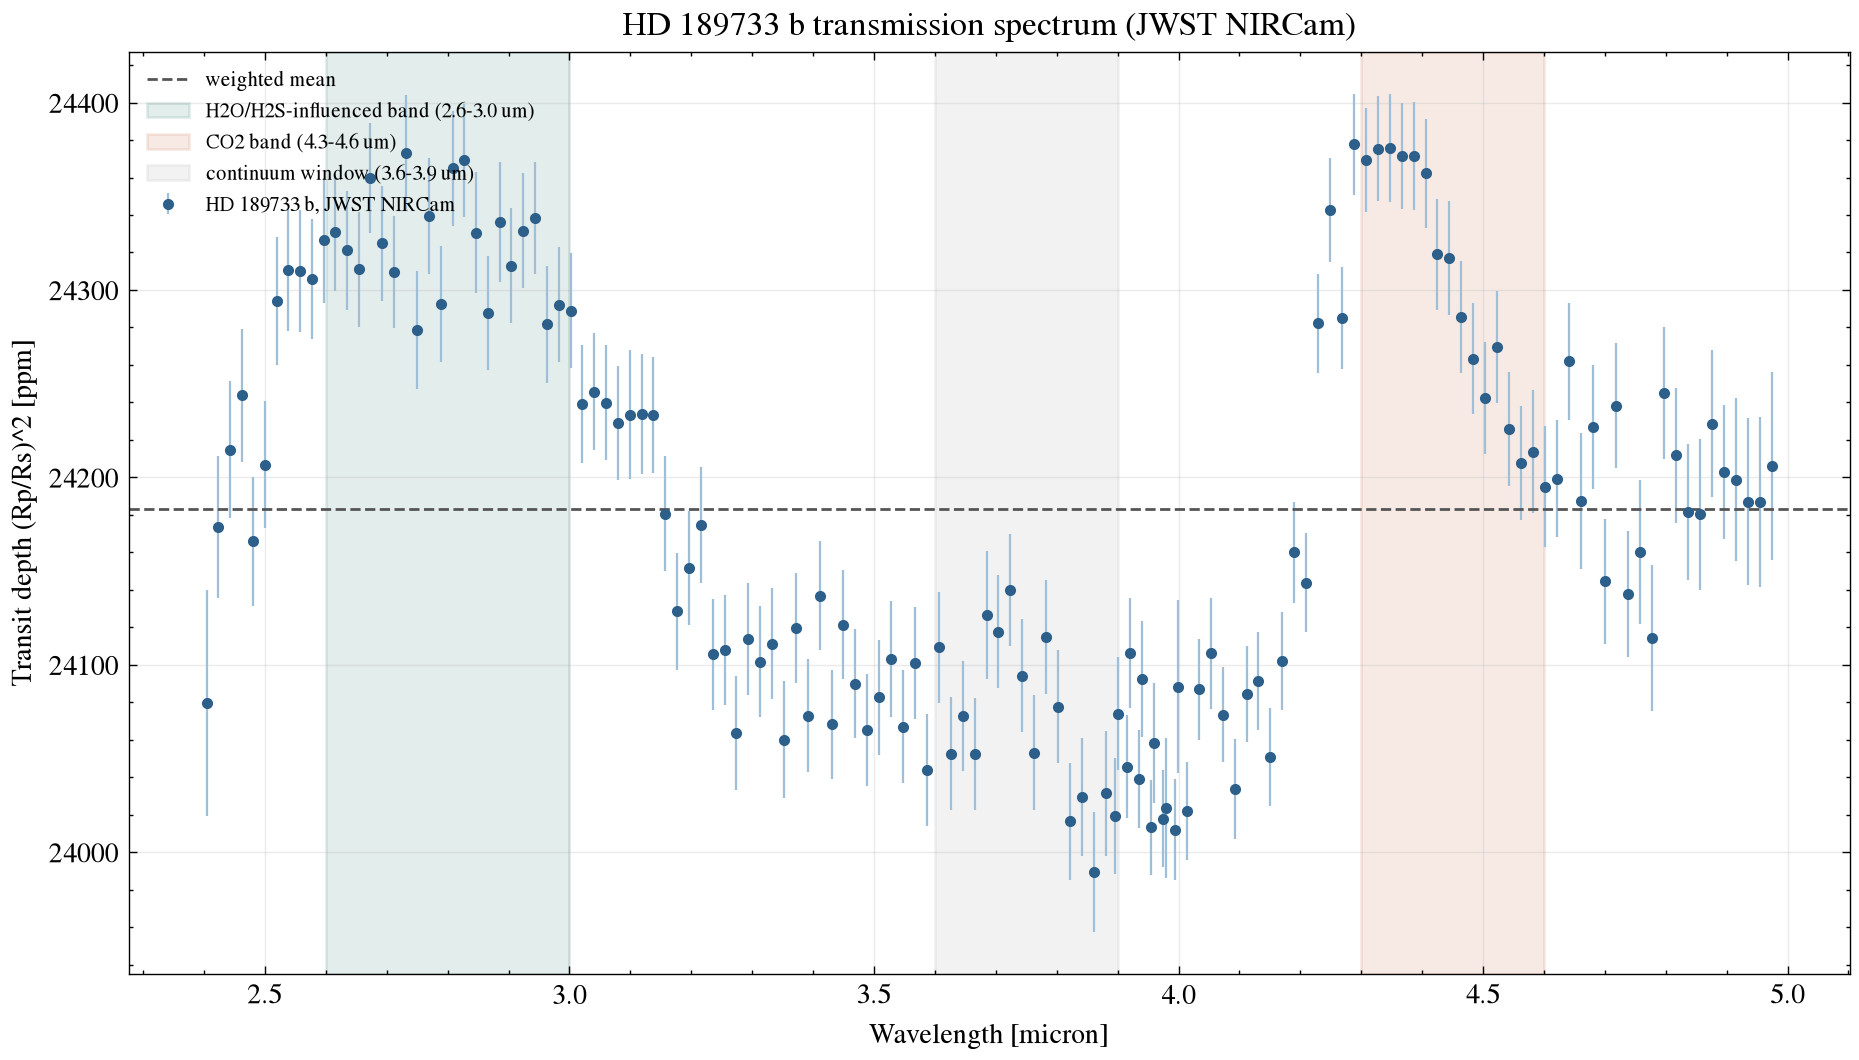
scripts/analyze_spectrum.py.The 22.1σ and 24.7σ numbers above are this page's own band-contrast signal-to-noise on a two-window comparison — they measure how much a wavelength range stands out from a nearby continuum, not the significance of any one molecule. A window like 2.6-3.0 microns has both H2O and H2S contributing, and the continuum choice itself shapes the result. Fu et al. (2024) get their molecular significances from a full atmospheric retrieval that models all the absorbers and the continuum together: H2O at 13.4σ, CO2 at 11.2σ, CO at 5σ, H2S at 4.5σ. Both approaches agree the spectrum has real structure in these regions — only the retrieval says which molecule is doing the absorbing.
Data and method notes
System parameters come from the NASA Exoplanet Archive TAP service. The spectrum is reduced JWST NIRCam data released publicly on Zenodo (record 10.5281/zenodo.11459715). See data/ for the file as downloaded and scripts/analyze_spectrum.py for the band-comparison analysis (python scripts/analyze_spectrum.py to rerun it).
AI-generated illustration of the James Webb Space Telescope, whose NIRCam instrument took the real spectrum used in this report. Not an official mission photograph — see NASA/JWST for real imagery.
References
- Bouchy, F. et al., 2005. ELODIE metallicity-biased search for transiting Hot Jupiters. II. A very hot Jupiter transiting the bright K star HD 189733. Astronomy & Astrophysics, 444(1), pp.L15-L19.
- Knutson, H.A. et al., 2007. A map of the day-night contrast of the extrasolar planet HD 189733b. Nature, 447, pp.183-186.
- Pont, F. et al., 2013. The prevalence of dust on the exoplanet HD 189733b from Hubble Space Telescope camera spectroscopy. Monthly Notices of the Royal Astronomical Society, 432(4), pp.2917-2944.
- Fu, G. et al., 2024. Hydrogen sulfide and metal-enriched atmosphere for a Jupiter-mass exoplanet. Nature, 632, pp.752-757 (arXiv:2407.06163) — source of the spectrum and the retrieval significances quoted above.
- Zenodo record 10.5281/zenodo.11459715, "Products for 'Hydrogen sulfide and metal-enriched atmosphere for a Jupiter-mass exoplanet.'"
- NASA Exoplanet Archive, exoplanetarchive.ipac.caltech.edu.