Independent literature synthesis · updated 13 September 2026
What the papers actually say about precision RV spectrographs.
My source-linked reading guide to optical and near-infrared Doppler instruments: where they work, which numbers their papers report, what remains difficult, and which questions could support later analysis.
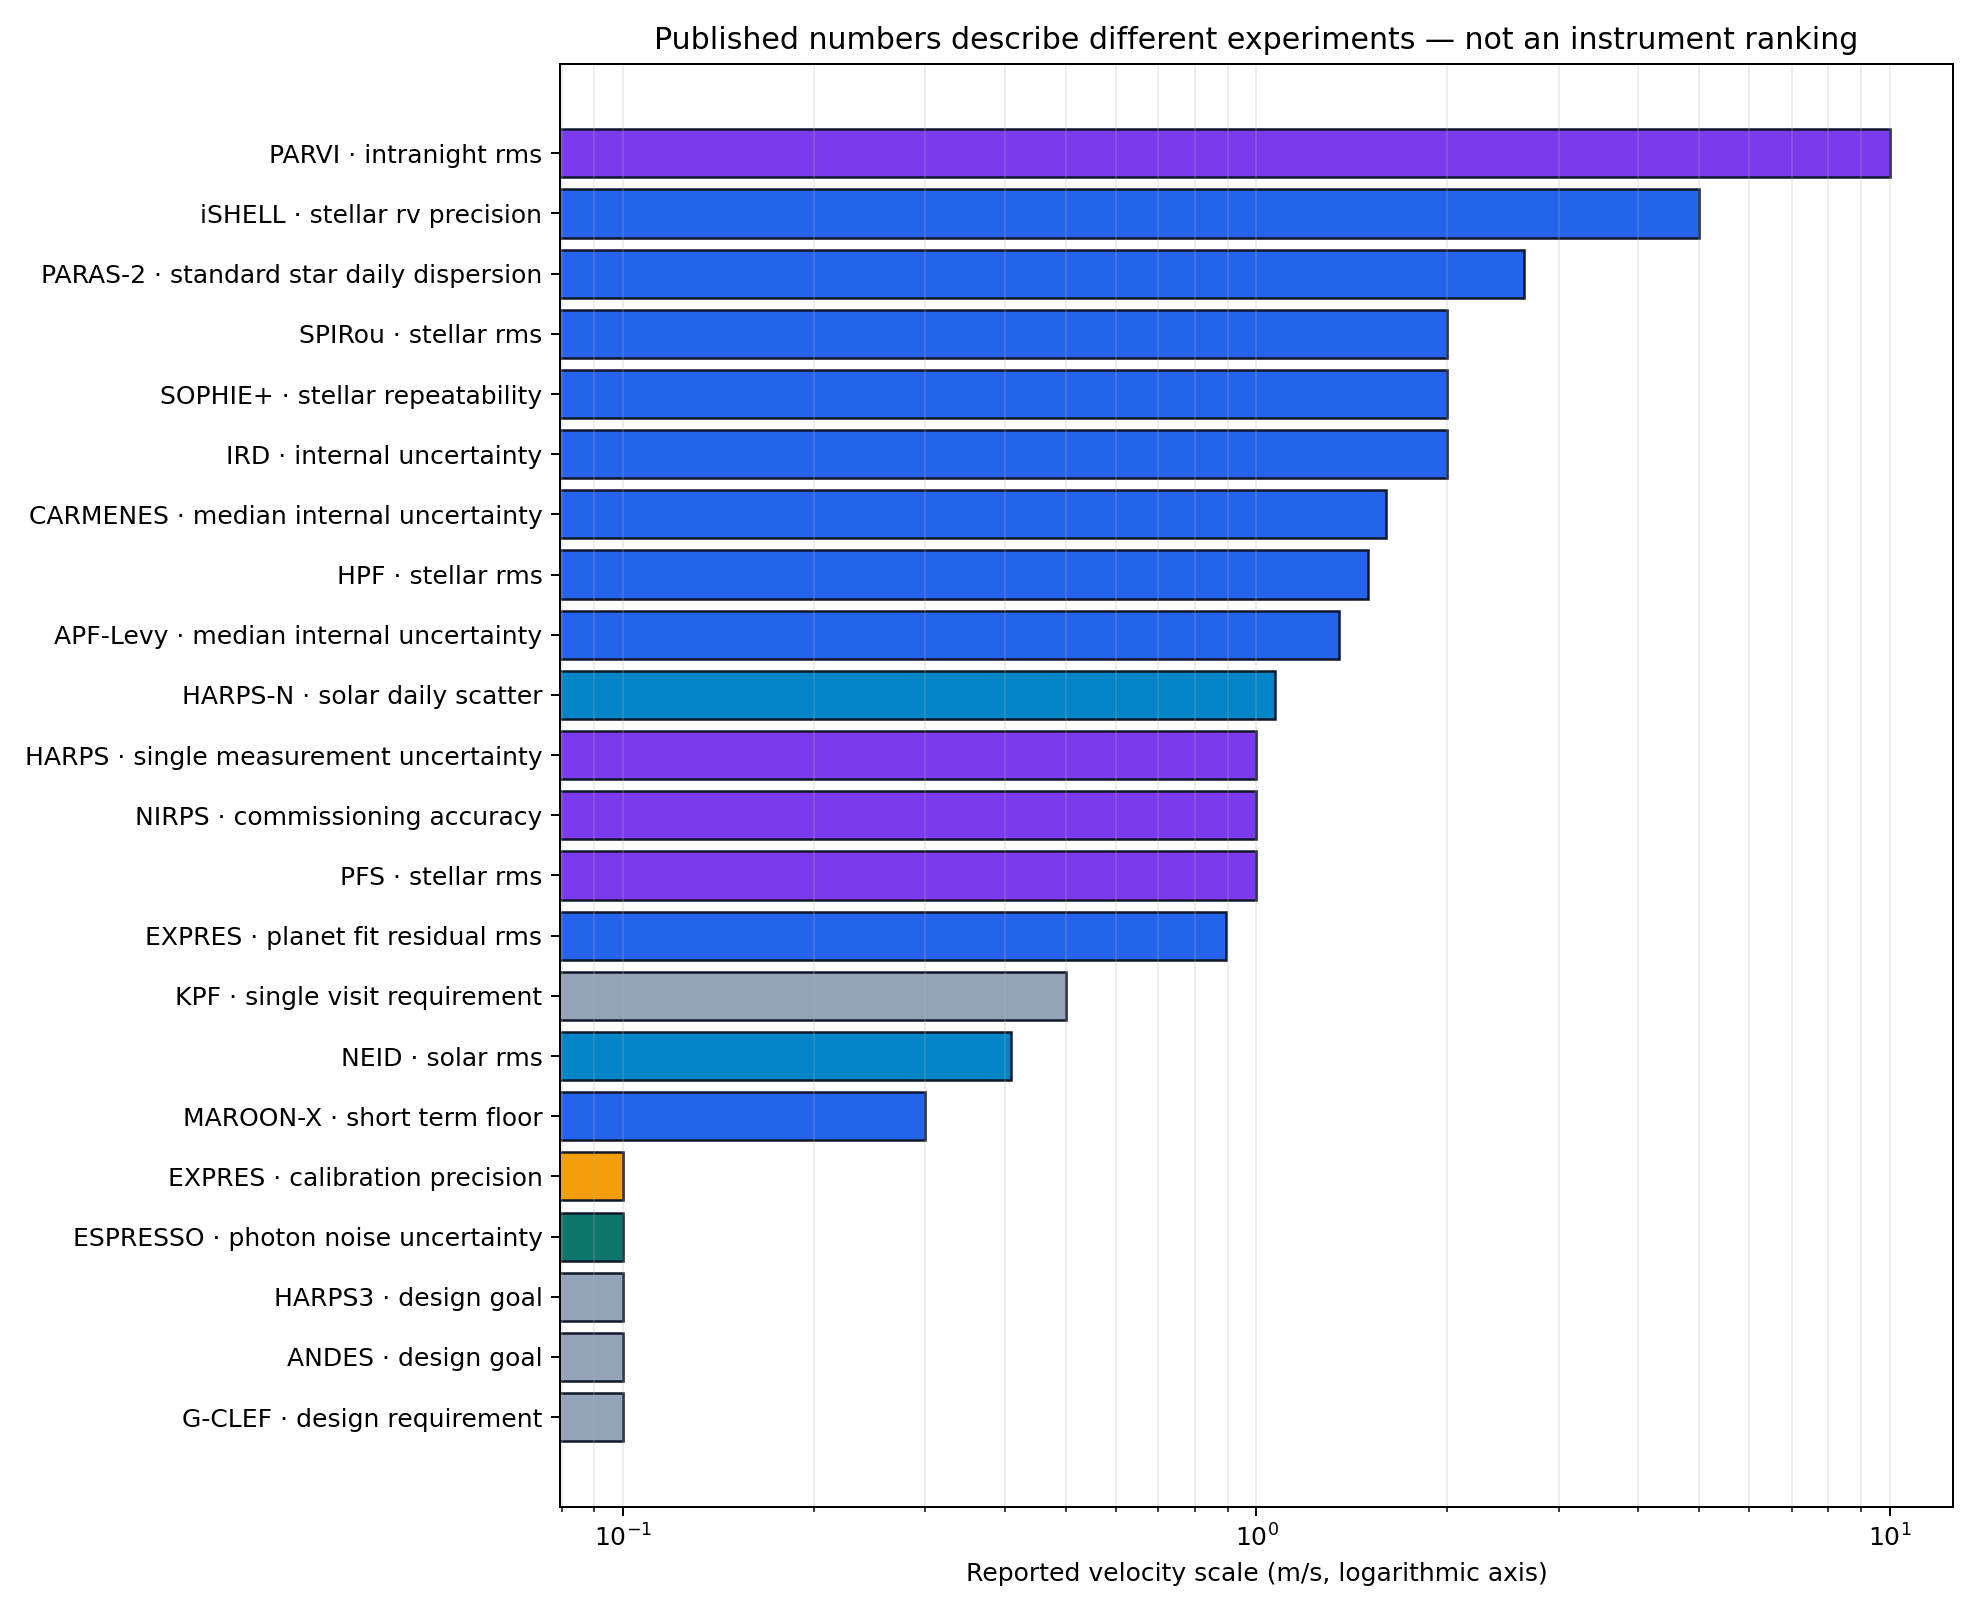
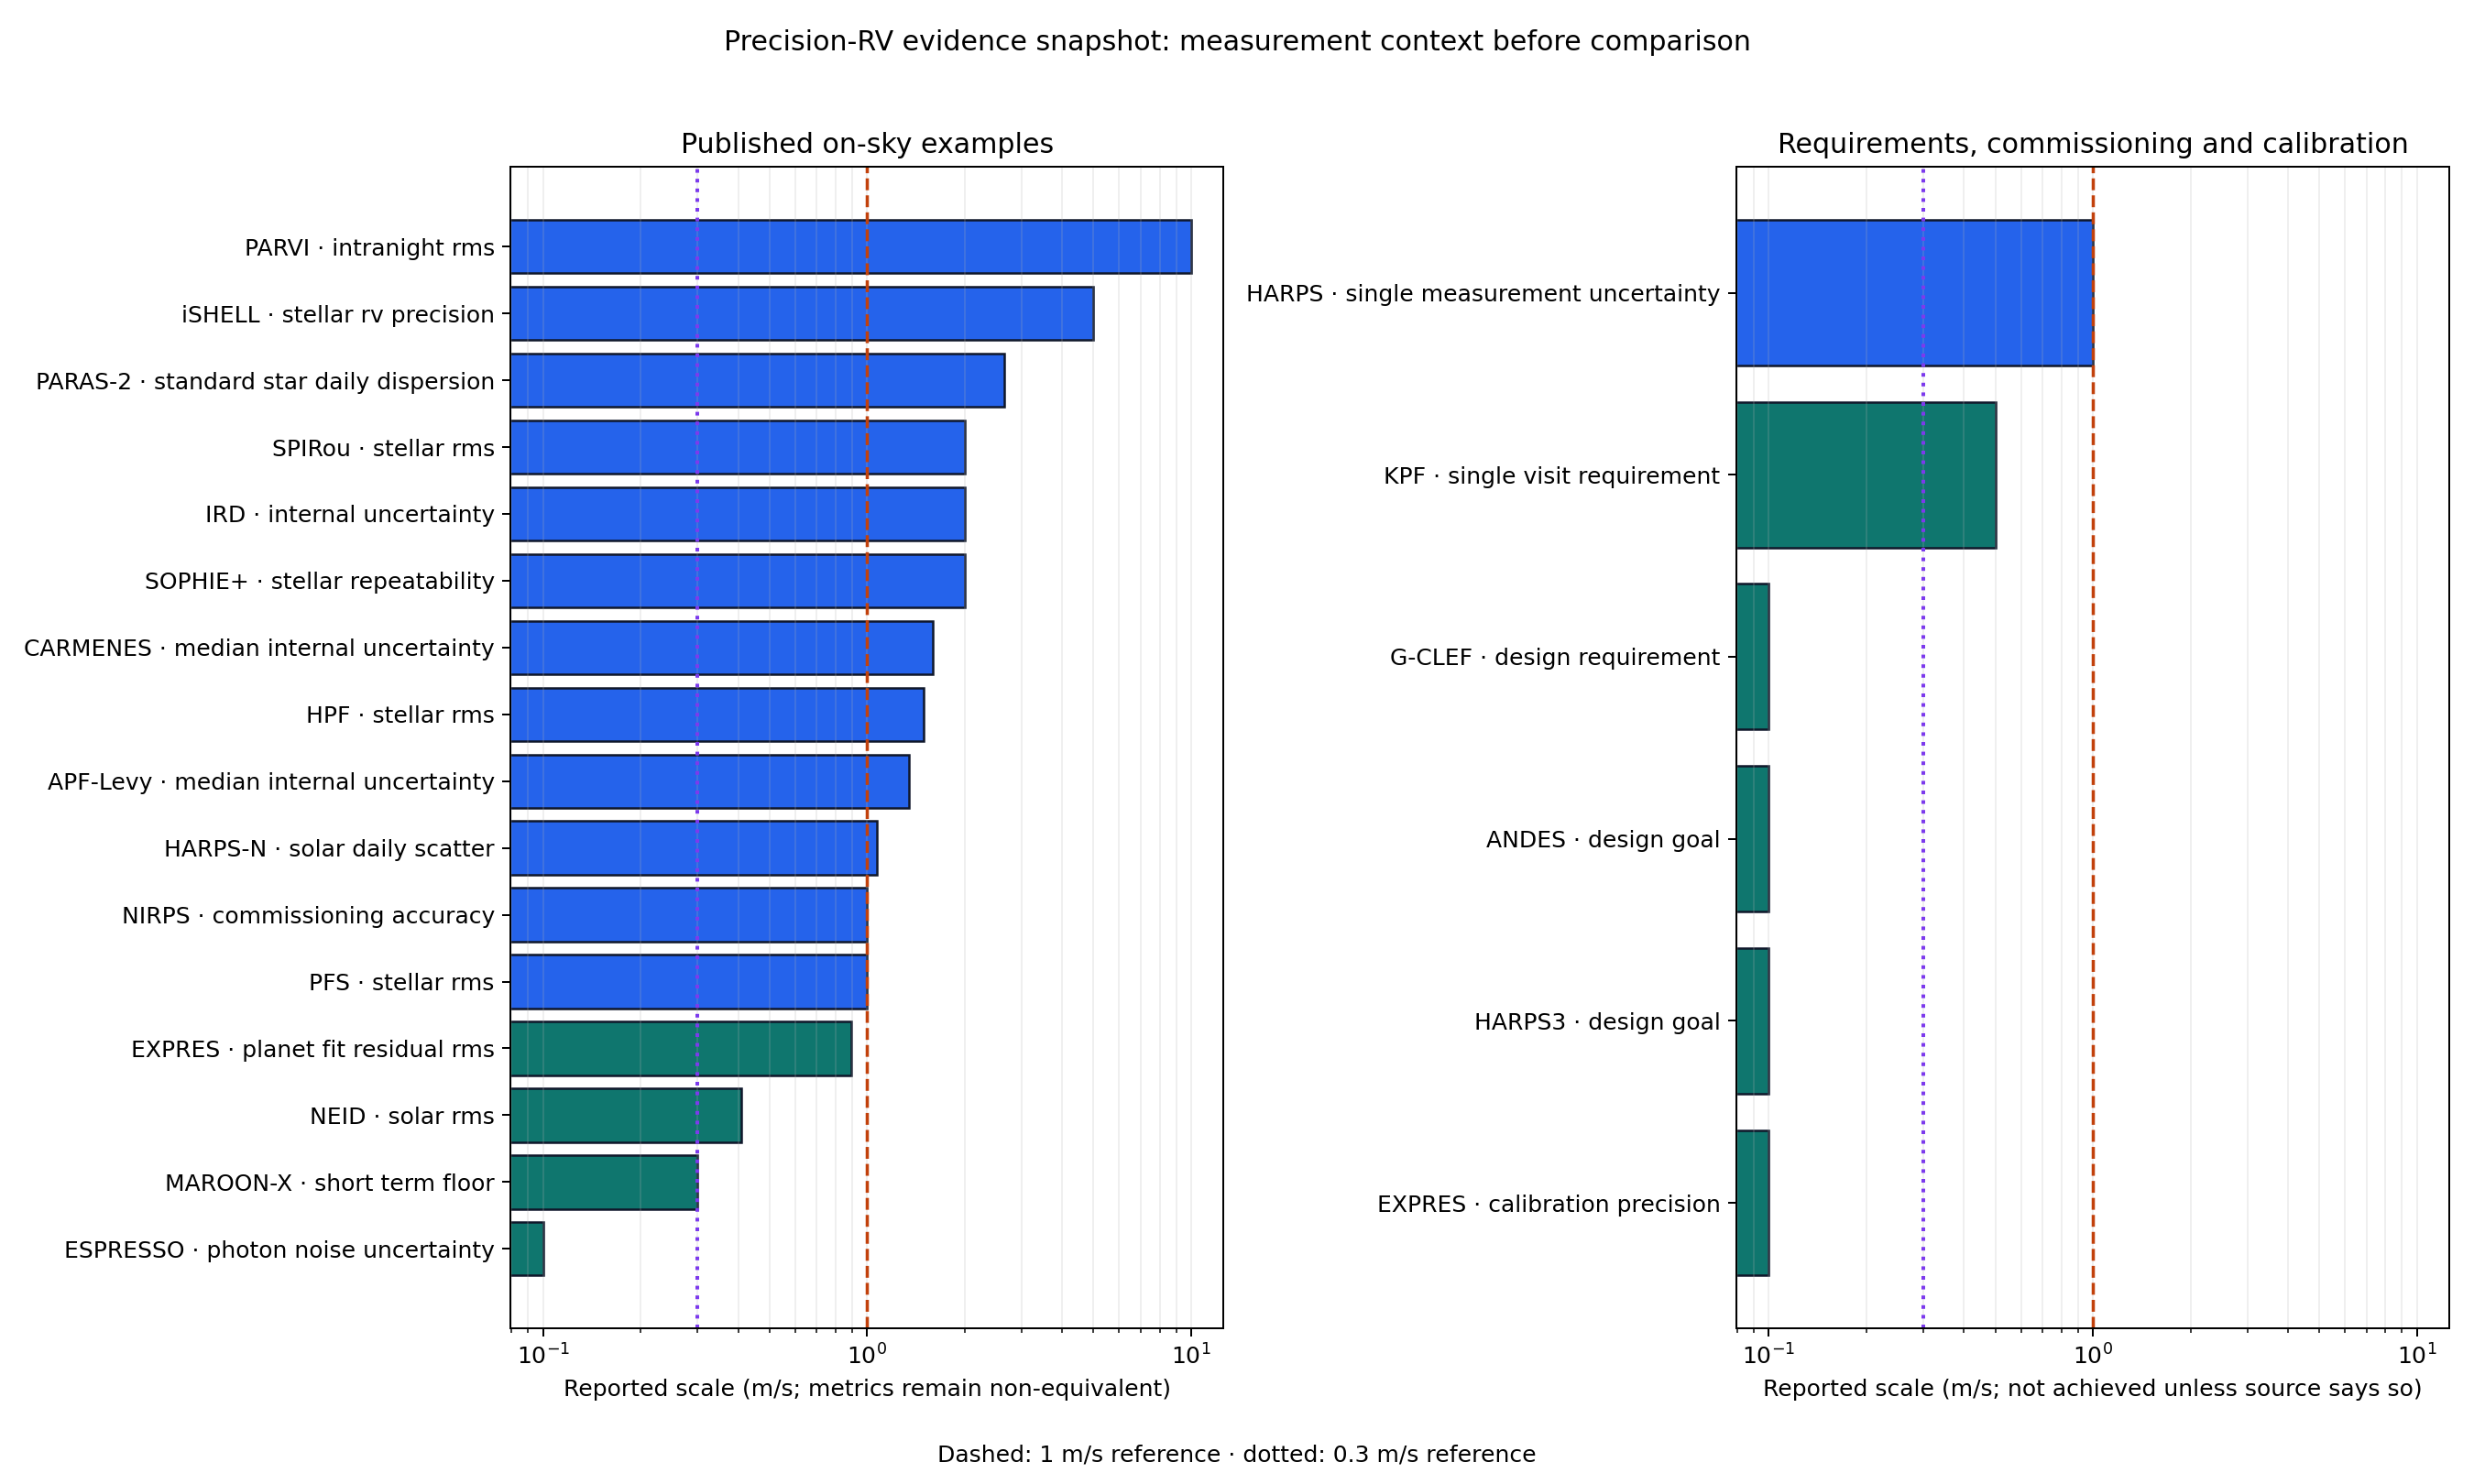
A careful boundary. A design goal, calibration test, formal uncertainty and stellar time-series RMS are different measurements. “Selected reading note” means I reviewed the listed sources; it does not mean every paper ever written about that instrument.
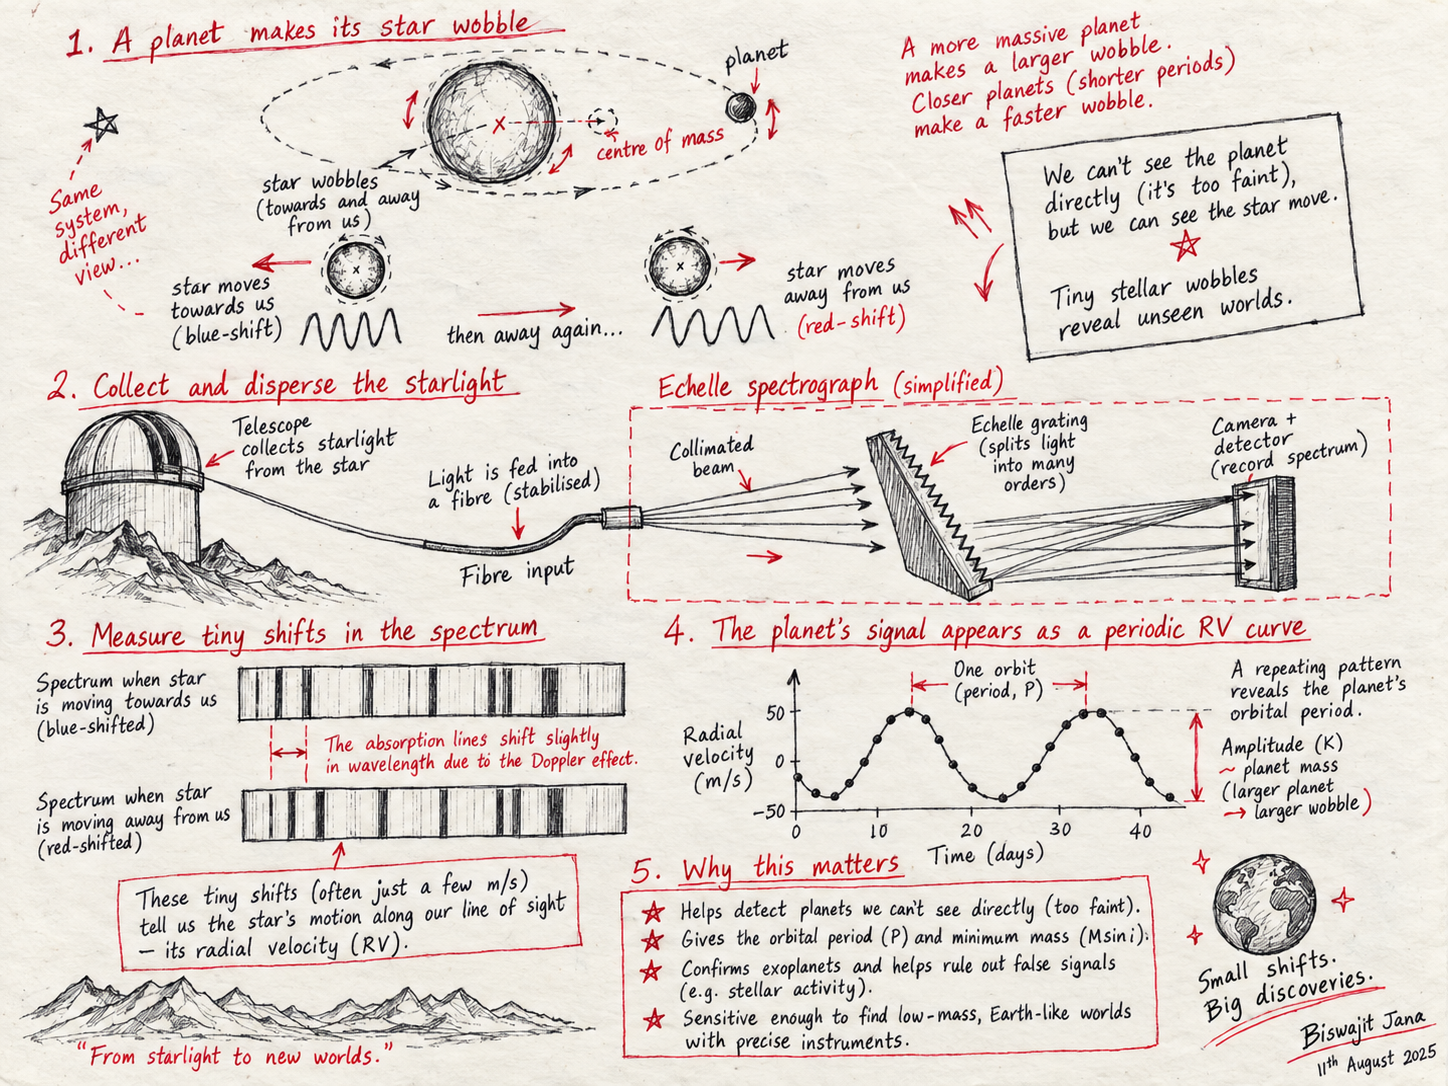
Begin here
From starlight to a velocity time series
A five-step measurement chain, the equations behind it, and the places where apparently similar spectrographs become scientifically different.
Calibration and extraction
Three common measurement architectures
Scope boundary
Not every spectrograph is an EPRV instrument
| Class | Examples | Measurement emphasis | In directory? |
|---|
Location guide
Where the instruments collect light
Each point uses a cited site or telescope coordinate. Several instruments at one observatory share a marker; this is a reading map, not a survey-grade geodetic product.
90° N
90° S
180° W
180° E
Ground facility◆Space spectrographs appear as comparator notes, not ground-map points
Base geography: Natural Earth 1:110 million, public-domain vector data rendered with a UN-style boundary view. Boundaries provide geographic context and do not imply a position on disputed territory.
Instrument directory
One record per physical spectrograph
The directory includes dedicated precision-RV systems, general high-resolution instruments with RV measurements, historical prototypes, and funded or commissioning projects.
Evidence is field-specific: a paper can confirm that an instrument exists without proving its present operating state or exact location. Open fields remain visible in each note.
Numbers from published studies
Compare specifications only within context
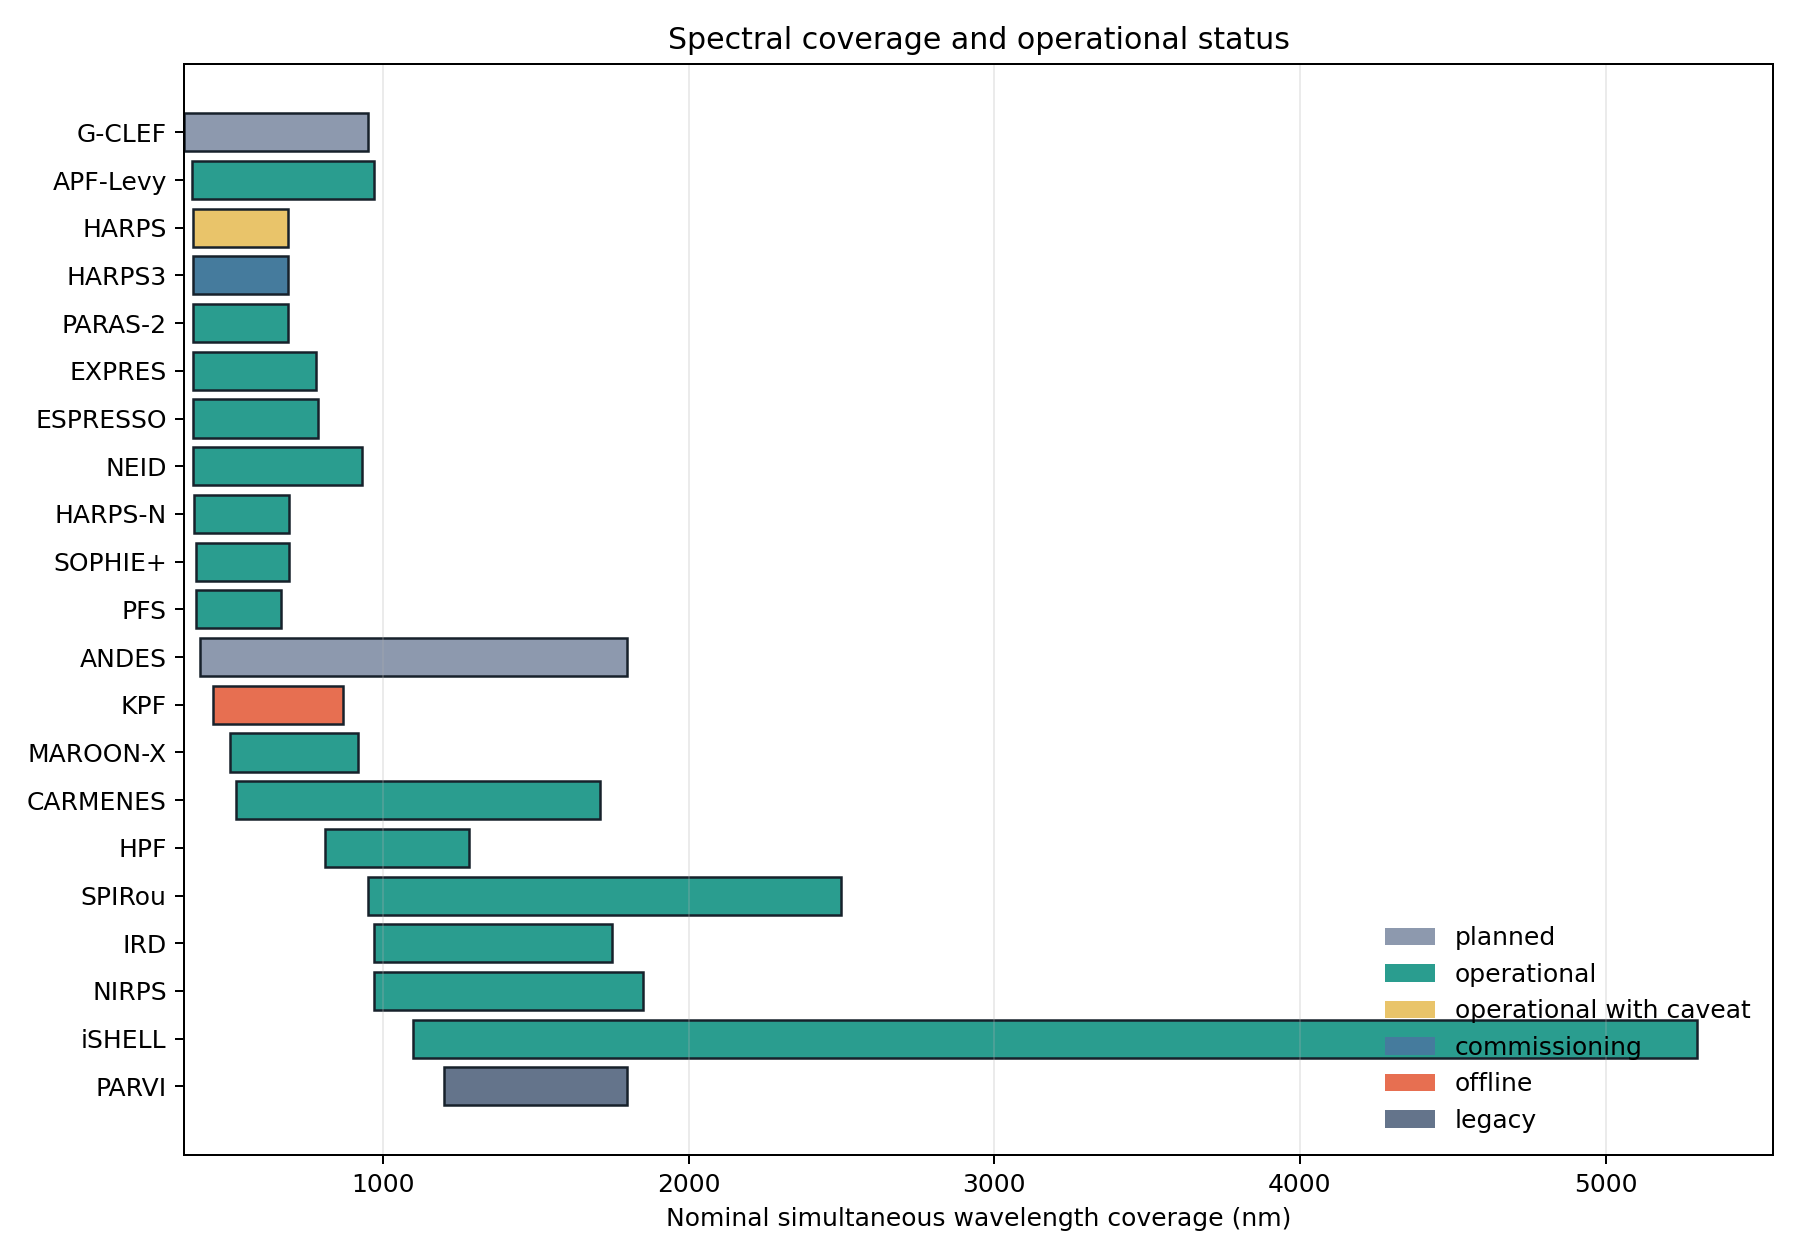
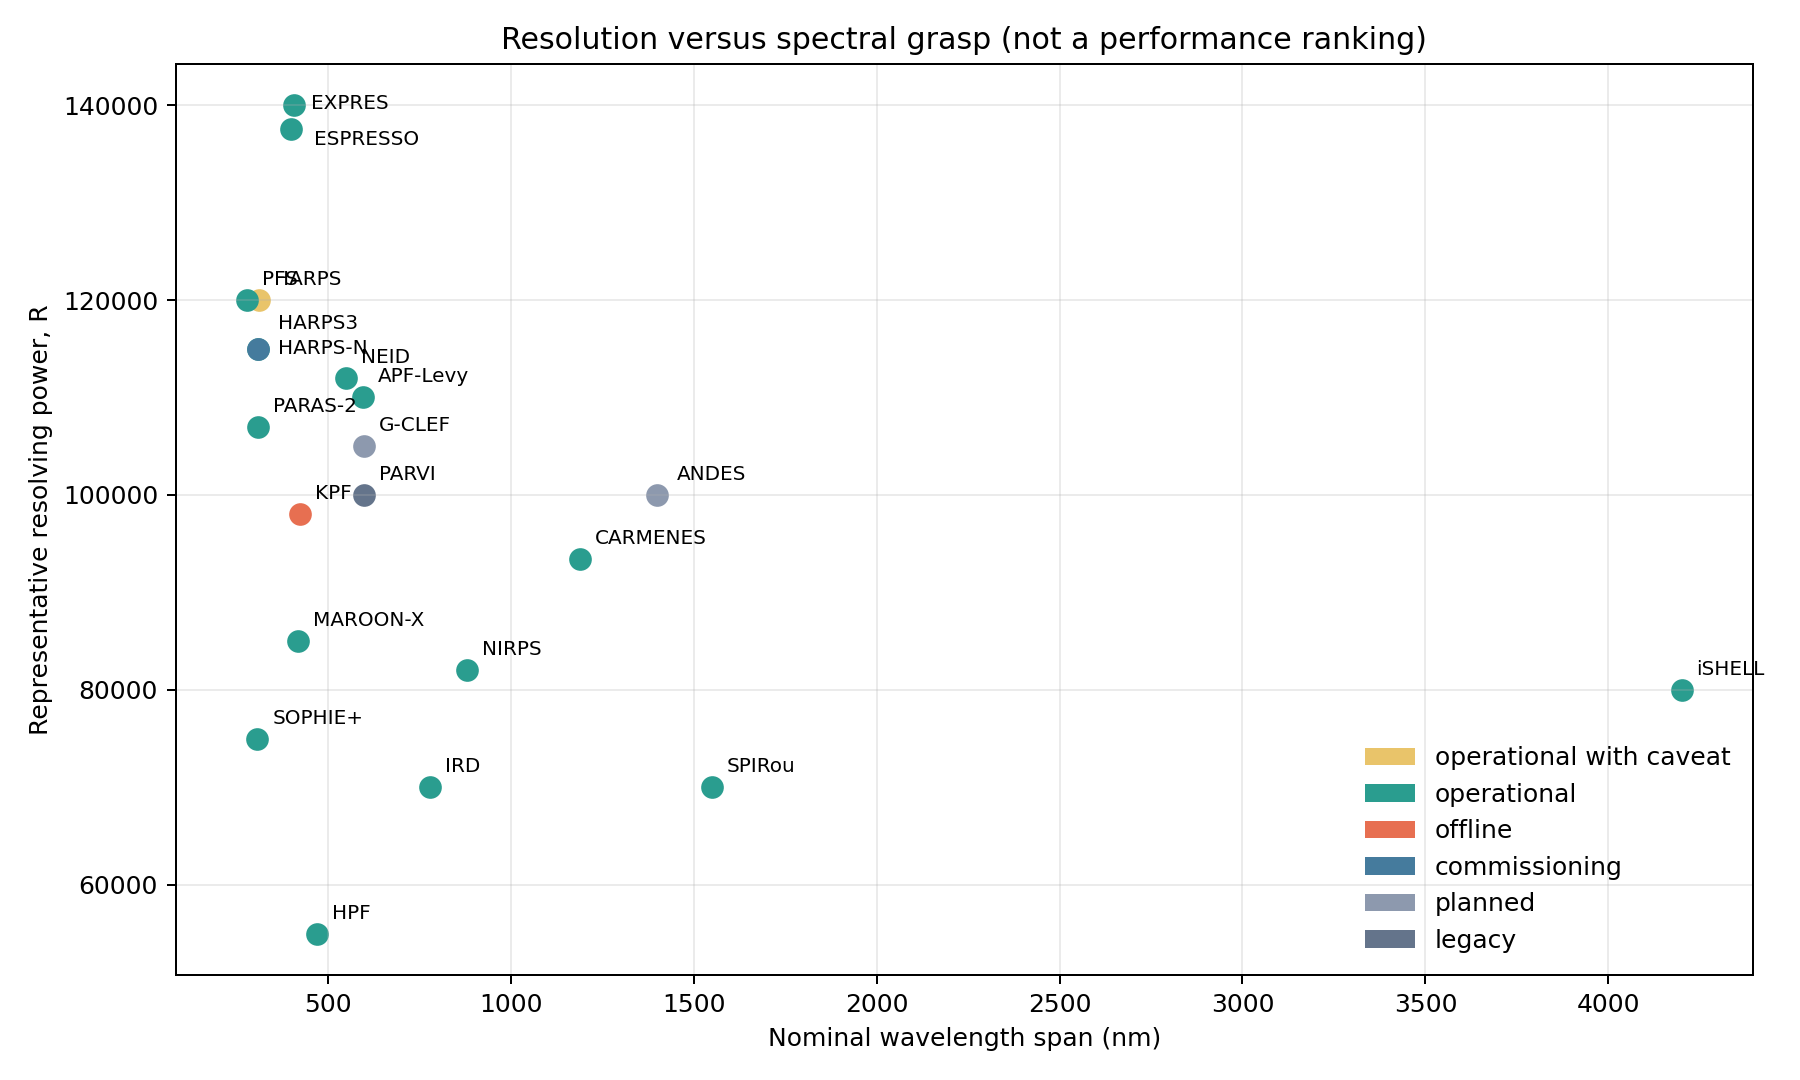
These 21 records have a numerical result tied to a paper. Wavelength limits and resolving power are representative modes, not acceptance-test values.
| Instrument | Facility | Coverage | R | Status | Evidence class |
|---|
Read the number in context
What did each number measure?
Open a card to see its target, baseline, limitation and primary paper.
Goal or requirementCalibrationOn-sky result
Paper-based interpretation
Nine coupled error domains
Each section states the mechanism, a published example, common mitigations, the residual problem, and links to the papers.
Original figures
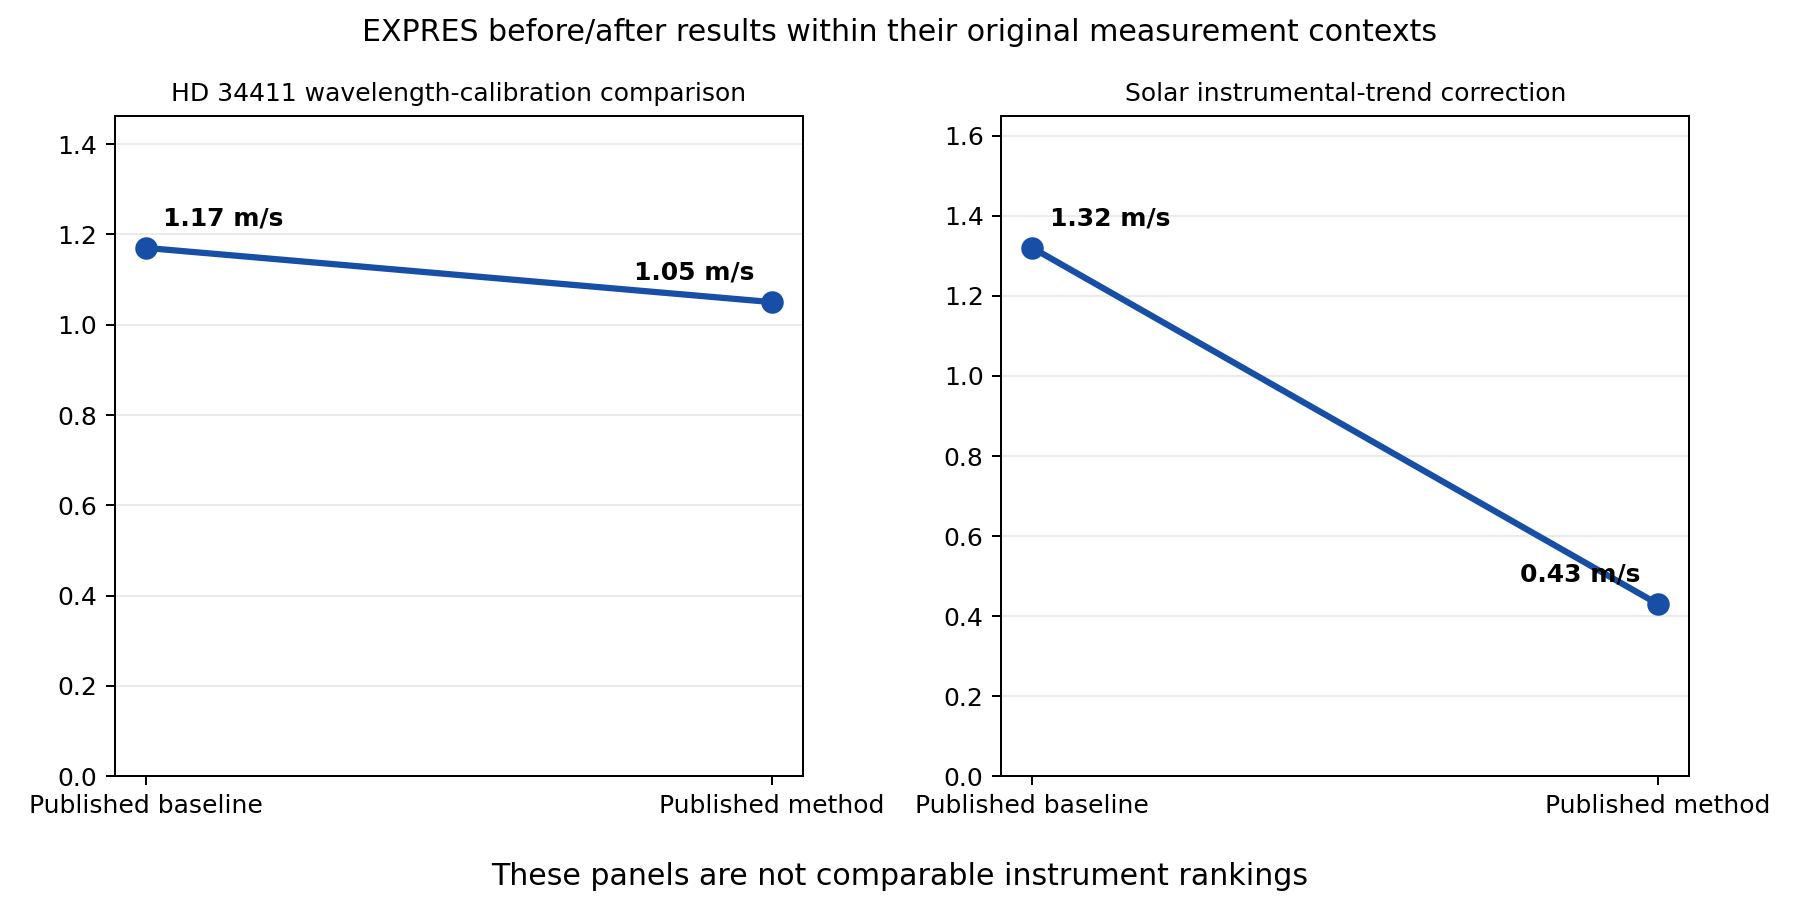
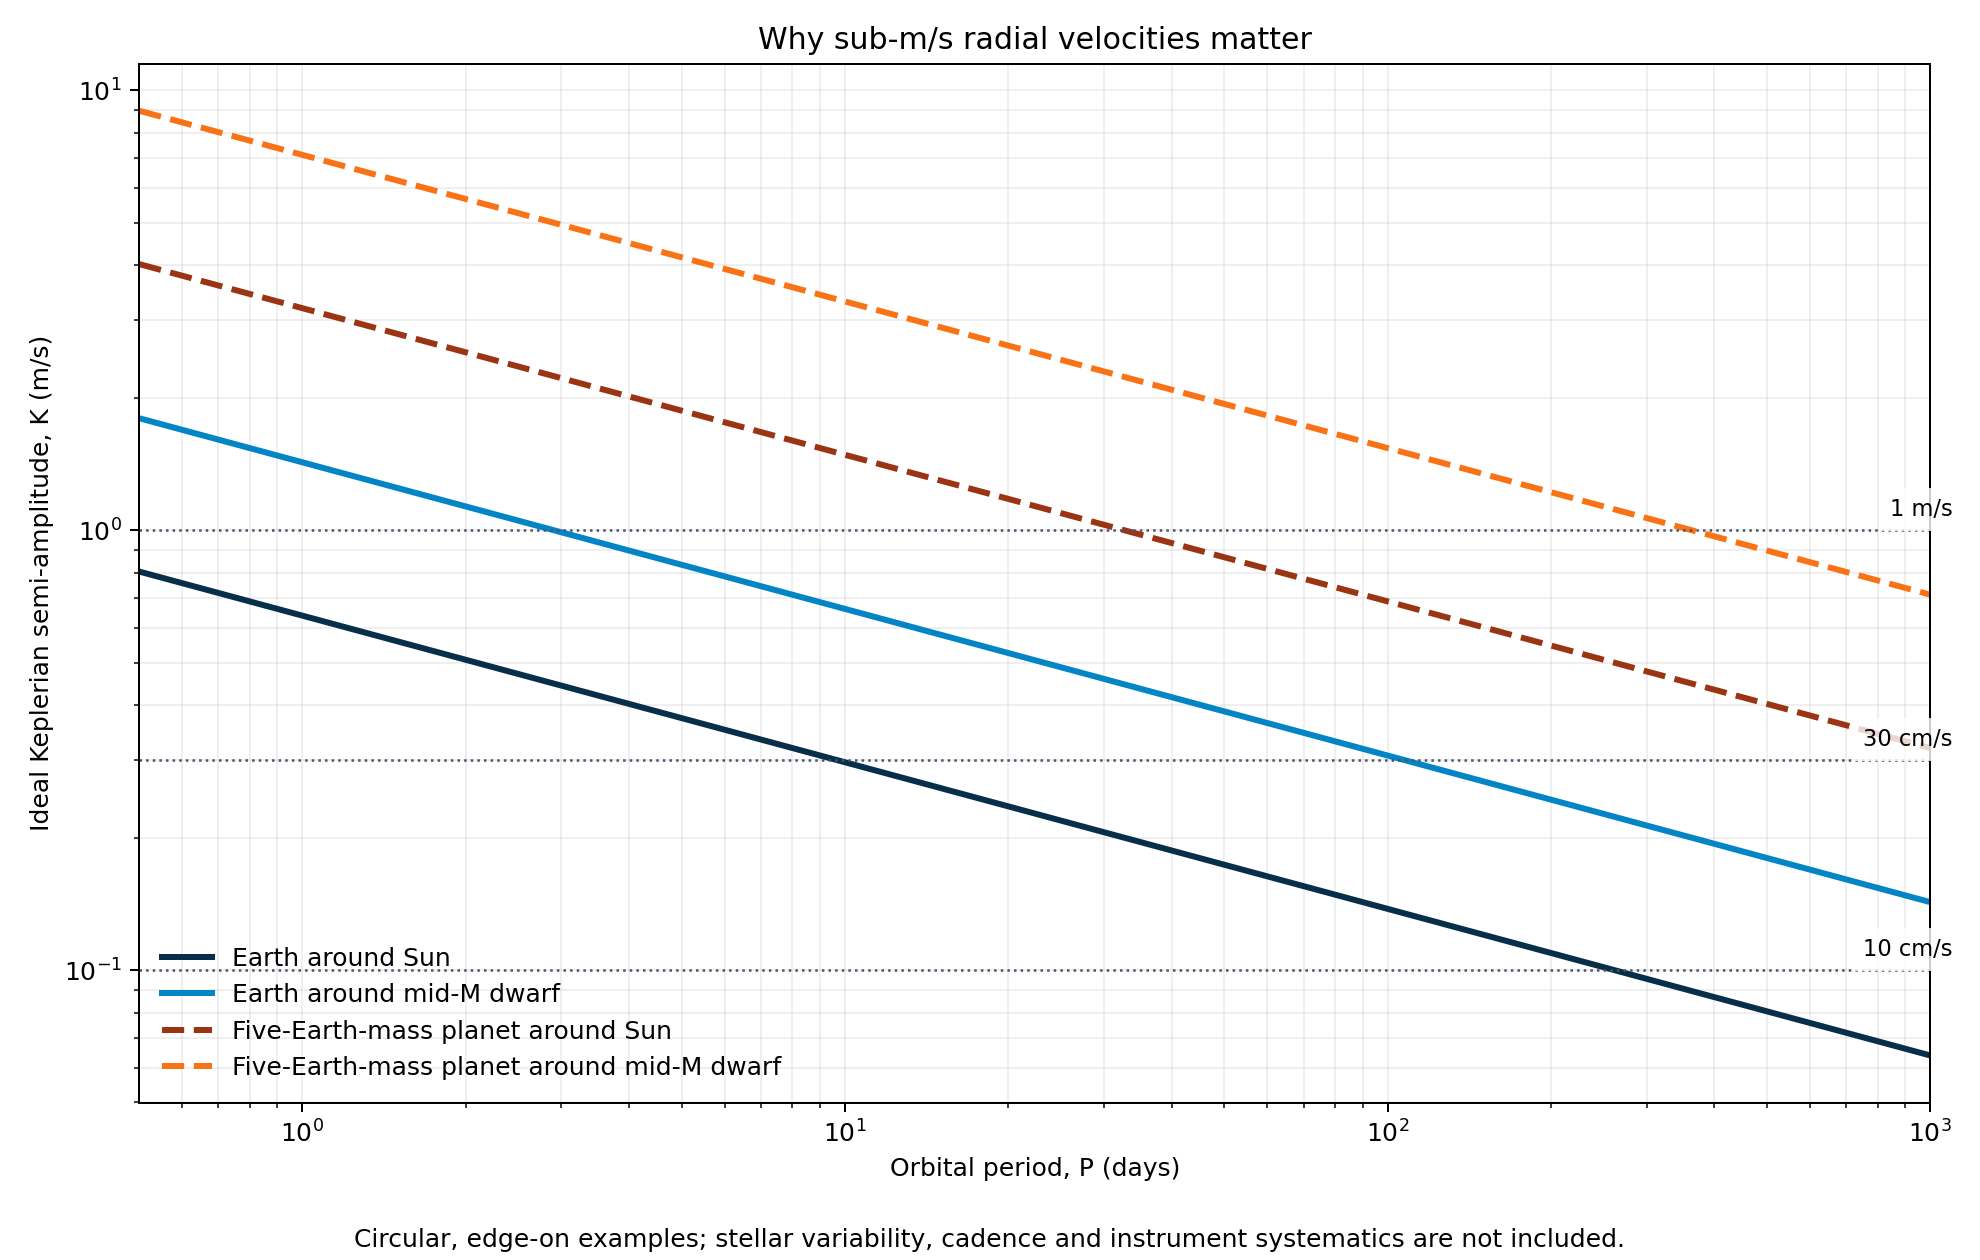
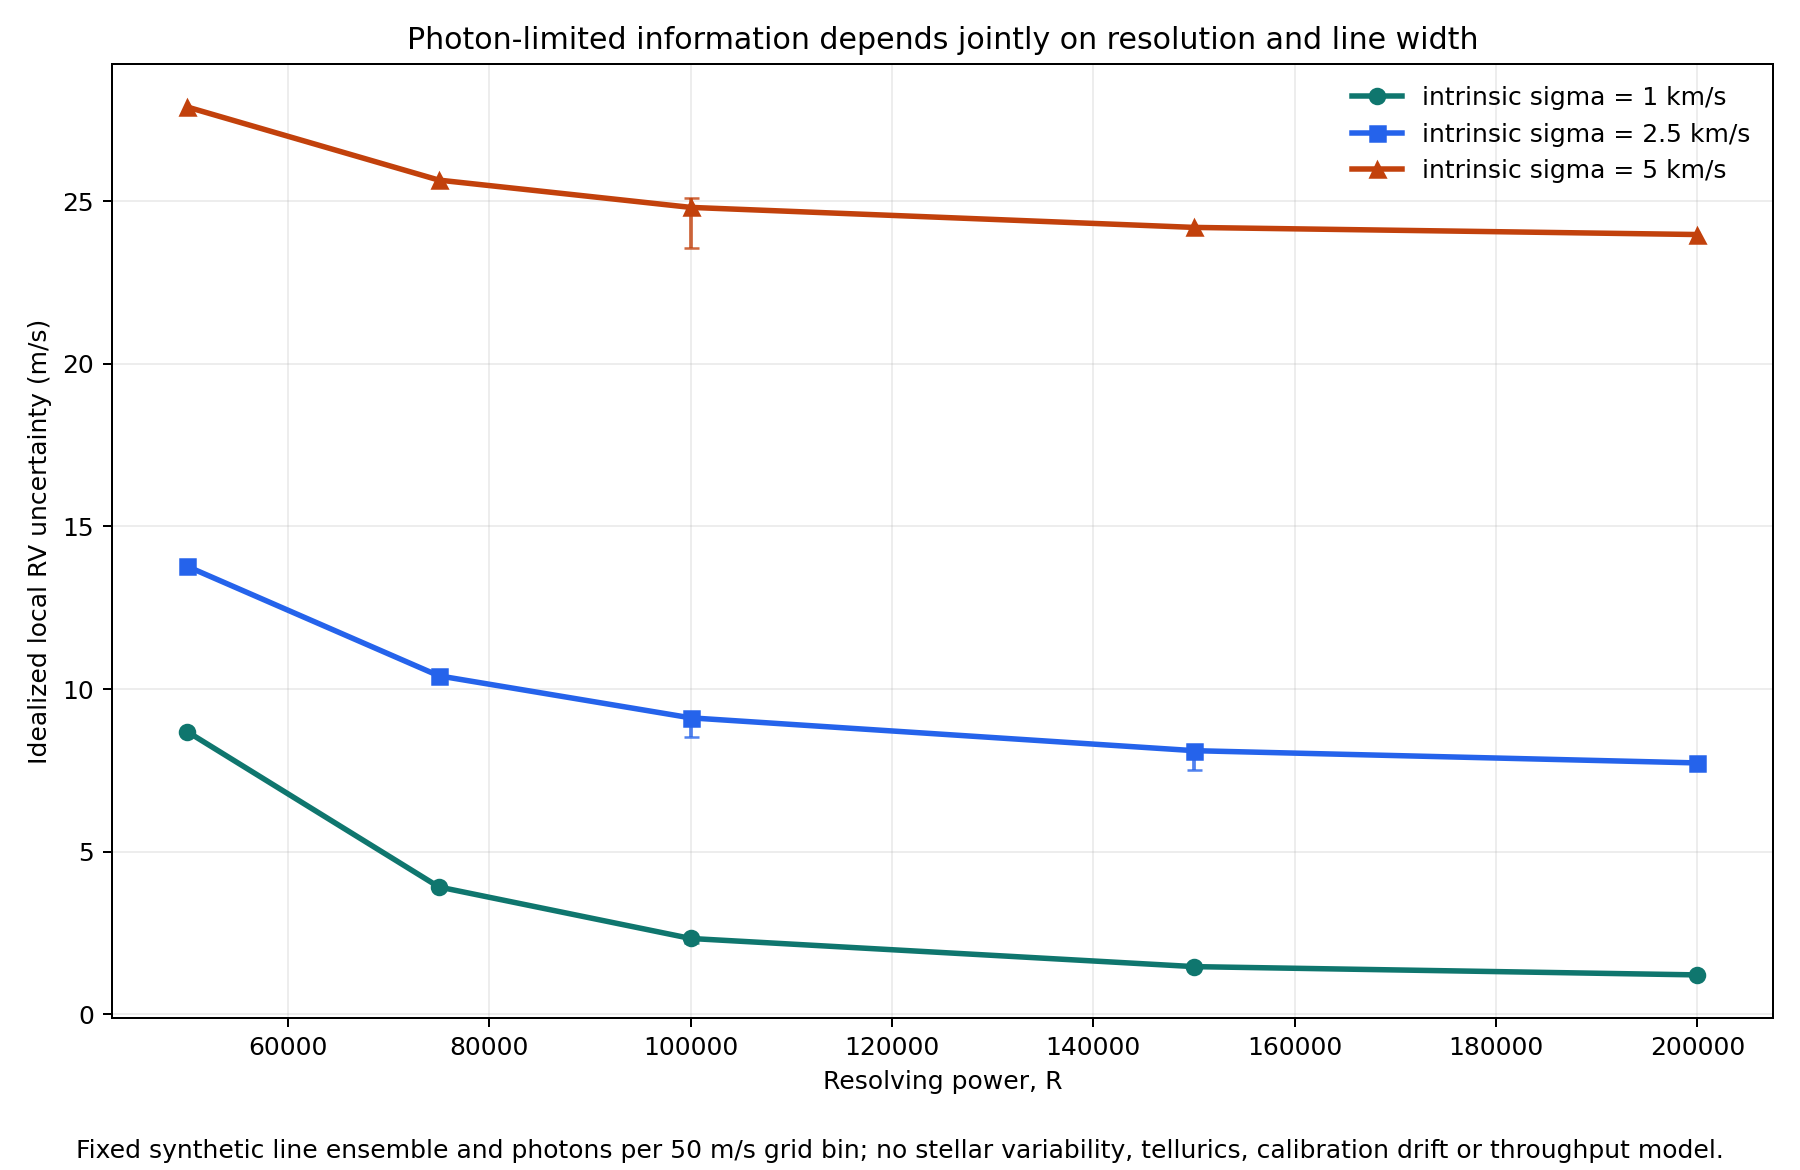
Context before comparison
Figures are generated from the committed tables. No third-party paper figure is reproduced.
How this was made
Every number points back to a source
Each numerical row records the metric, measurement context, target or sample, baseline, limitation, source URL and access date. Automated checks reject unknown instruments, duplicate identifiers and rows without a stated limitation.