A plot needs a chain of custody.
FITS extension shapes, source-frame indices, timestamps, hashing, and rounding tolerances turn a visual demo into an inspectable data product.
Biswajit Jana / independent learning project / 2026
How do wavefront measurements become a trustworthy scientific result? I explored this through released ESO CIAO telemetry, a reproducible sampling audit, and a separate wavefront-control model.
One released observation · approximately 30 seconds · six modelled aberration modes
Adaptive optics connects the subjects I want to understand together: astronomical instrumentation, wavefront sensing, and feedback control.
My aim was to build intuition from real telemetry while learning how an optical model and controller behave. Working through a public AOT dataset gave me a practical route from file formats and sensor streams to numerical validation and the limits of a claim.
The project’s contribution is the software and audit built around an existing release. The observations, instrument, and AOT standard belong to their original teams.
The telemetry pipeline and teaching model answer different questions. The model does not ingest CIAO measurements as reconstructed pupil phase.
Official CIAO1 AOT FITS file, published MD5, local SHA-256, metadata, and attribution.
Provenance record ↗Every 50th frame; timestamps and indices retained; six-decimal JSON values for four streams.
Conversion code ↗Exact source parity, mean and percentile distortion, and full-rate power above the reduced Nyquist limit.
Machine-readable audit ↗Worker-prepared telemetry maps, sampled trends, frame inspection, and explicit interpretation limits.
Open the observation ↗Noll modes → delayed feedback → residual phase → FFT intensity. An opt-in teaching model supports controlled experiments. It is not a reconstruction of the CIAO controller or telescope PSF.
Model guide →All 79,200 retained telemetry values, 300 timestamps, and 300 source indices pass the declared parity tolerance. The three scalar diagnostics also pass the study’s mean and percentile thresholds.
Each diagnostic exceeds the 5% temporal acceptance limit. These are study-specific thresholds, not universal AO standards. A gate failure here limits the browser product; it does not indicate a fault in the telescope.
Read the quantitative interpretation →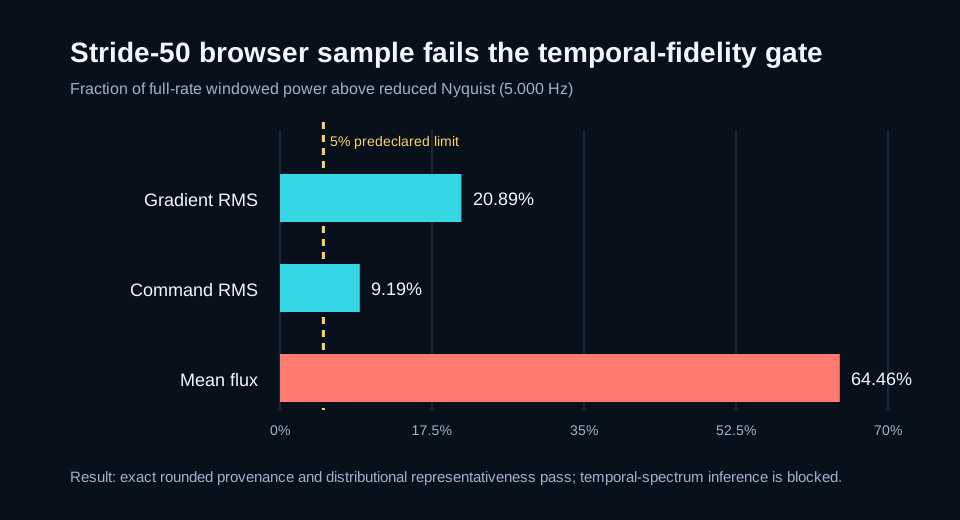
FITS extension shapes, source-frame indices, timestamps, hashing, and rounding tolerances turn a visual demo into an inspectable data product.
A sample can reproduce a distribution and still lose temporal content. Numerical integrity, representativeness, and physical interpretation require separate evidence.
Noll normalization, sampled-pupil FFTs, delay, noise, and the exact feedback recurrence determine what the model can teach. Hardware calibration is still required for telescope inference.
How should a compact telemetry product be designed for a specified scientific use?
My proposed next experiment compares the current point sample with an explicitly filtered reduction and a full-rate reference. I would define the target bandwidth, filter response, edge handling, and acceptance tests before running the comparison. This is proposed work.