Persistent inner-atmosphere structure
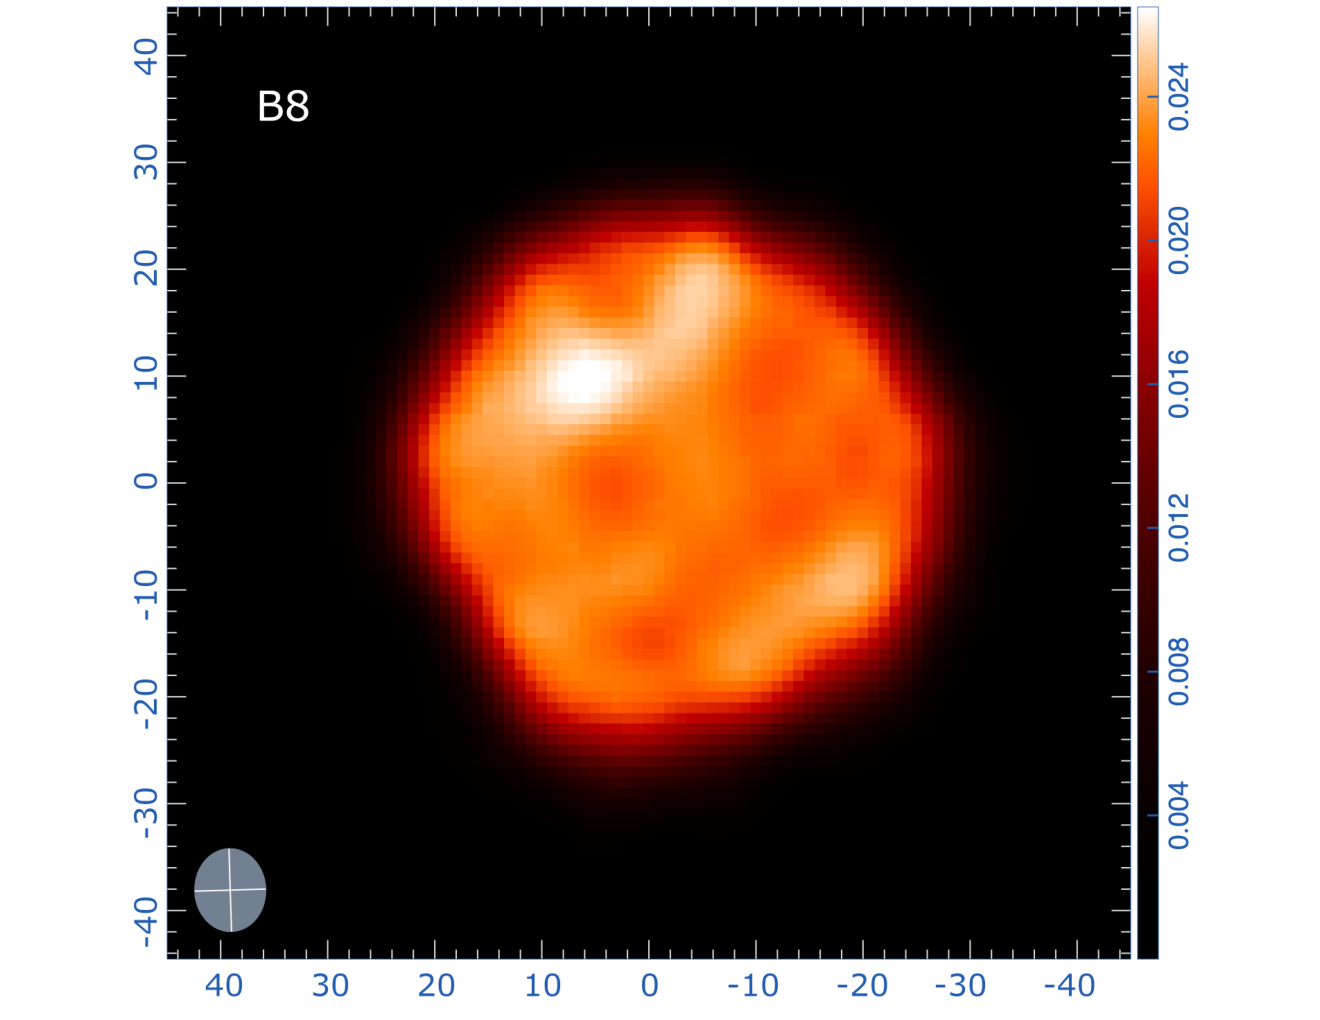
Bands 6, 7, and 8 resolve a roughly 2300 K sub-millimetre photosphere, with hotter north-east and south-west regions and changed molecular gas since 2015.
- Observed
- Aug 2023
- Published
- 19 Aug 2026
A causal, data-first stellar observatory
We see Betelgeuse through its past light cone. The newest high-resolution data show a living, dynamic red-supergiant atmosphere - not an observed supernova.
Causality scenario tool
It does not subtract from a remaining-lifetime prediction conditioned on that observed state.
D/c = 172 pc × 3.26156 yr pc−1 = 561.0 yr
temit = 2026 - 561.0 = 1465.0
tcollapse = 1465.0 + 300 = 1765.0
tarrival = 1465.0 + 300 + 561.0 = 2326.0
tarrival = 2026 + 300 = 2326
∂tarrival/∂D = −1/c + 1/c = 0
Change the distance: the emission and coordinate-collapse years move, but the Earth waiting time remains 300 years.
What we actually see
Latest received evidence
Bands 6, 7, and 8 resolve a roughly 2300 K sub-millimetre photosphere, with hotter north-east and south-west regions and changed molecular gas since 2015.
Seven VLA/ALMA frequencies trace different atmospheric radii. Ellipticity correlates with the proposed companion orbital phase.
ESO reports a 6.1 sigma PACO-ASDI detection at 52.32 +/- 0.18 mas in SPHERE-ZIMPOL programme 114.28H9.
The star in many wavelengths
Observational layers
Frequency changes optical depth, resolution, emitting layer, and instrument response. Every comparison must carry that metadata.
| Mode | Instrument | Approximate layer | Product status |
|---|---|---|---|
| UV | HST STIS/GHRS | chromosphere and wind | archive spectrum |
| Optical | AAVSO / resolved imaging | photosphere and dust attenuation | photometry / imaging |
| Near-IR | interferometry | molecular layers and photosphere | archive-dependent |
| 223.55 GHz | ALMA Band 6 | larger sub-mm optical-depth surface | observed Aug 2023 |
| 337.99 GHz | ALMA Band 7 | inner sub-mm atmosphere | observed Aug 2023 |
| 485.22 GHz | ALMA Band 8 | deeper, smaller sub-mm surface | observed 1 Aug 2023 |
| 22-136 GHz | VLA + ALMA | extended radio atmosphere | observed 2021-2026 |
Quantitative evidence
Published measurements + reproducible equations
The plots below use the three published ALMA 2023 integrated-continuum measurements. Error bars are measurement uncertainties; fitted curves are calculated quantities.
Weighted in log space
Sν = A (ν/ν0)α
A = 0.518 Jy at ν0 = 337.99 GHz; α = 1.494 ± 0.133.
Qualitative reading: the integrated flux rises with frequency, but more slowly than a fixed-area, optically thick Rayleigh–Jeans ν2 reference. The changing apparent size and atmospheric optical depth prevent a one-parameter physical interpretation.
Uniform elliptical-disc fit
L (AU) = θ (mas) × D (pc) / 1000
At 172 pc, Band 8 gives L = 9.34 AU and R ≈ 1004 R☉. Distance uncertainty scales these values linearly.
Qualitative reading: higher observing frequency reaches a smaller τν ≈ 1 surface. The reported mean brightness temperatures remain close—2342, 2294, and 2266 K—so diameter, opacity, and temperature must be interpreted together.
| Band | ν (GHz) | Sν (Jy) | 1σ (Jy) | θ (mas) | Tb (K) |
|---|---|---|---|---|---|
| Band 6 | 223.55 | 0.28 | 0.014 | 62.14 | 2342 |
| Band 7 | 337.99 | 0.51 | 0.040 | 57.74 | 2294 |
| Band 8 | 485.22 | 0.90 | 0.090 | 54.30 | 2266 |
Source: Dent et al. (2026), ALMA observations obtained in August 2023. The power-law line is this repository’s uncertainty-weighted three-point calculation, not the paper’s spatially resolved spectral-index map.
Herschel's 1836–1840 comparison estimates are shown as individual points. From 1893 onward, AAVSO visual estimates and Johnson V measurements remain separate and are summarized with robust time bins. No photographs or interpolated observations are inserted.
F/F0 = 10−0.4(m−m0)
A one-magnitude increase means a factor 2.512 decrease in flux. The relative-flux switch is an exact magnitude conversion with m0 = 0.5; it is not a physical forecast.
m̃k = median(mi∈k), IQRk = Q3−Q1
The overview uses 90-day bins; the recent panel uses 30-day bins. Medians suppress isolated transcription errors, while the shaded quartiles retain within-bin observer scatter and intrinsic change.
| Series | Epoch | Underlying records | Plot treatment |
|---|---|---|---|
| Herschel / Lloyd | 1836–1840 | 27 estimates | Individual reconstructed visual magnitudes |
| AAVSO visual | 1893–2026 | 48,378 detections | Separate robust time bins; no interpolation across gaps |
| AAVSO Johnson V | 1964–2026 | 3,082 detections | Separate filter series; never merged into visual estimates |
Sources: Lloyd (2020) and the AAVSO International Database, AUID 000-BBK-383, retrieved 31 August 2026. The AAVSO series includes only detections within the documented −0.5 to 3.0 magnitude quality screen; 86 upper-limit or implausible rows were excluded. Visual and V passbands are related but not identical measurements.
Figure conventions follow Dent et al. (2026); values are generated from the published component fits, not extracted from the editorial PNG.
Contours: 4, 8, 12, 16, 20, 22, 23, 24, 25, 26 mJy beam⁻¹ · dashed circle: 42 mas optical diameter · lower-left ellipse: 7.7 × 6.6 mas restoring beam.
Solid warm contours: +2,+4 mJy beam⁻¹ · dashed cool contours: −2,−4 mJy beam⁻¹. Residual morphology is illustrative, not a calibrated difference image.
| Radius (mas) | Band 7 (Jy beam⁻¹) | Band 8 (Jy beam⁻¹) | α |
|---|---|---|---|
| 0 | 4.320e-2 | 8.046e-2 | 1.72 |
| 21 | 4.227e-2 | 6.737e-2 | 1.29 |
| 30 | 1.583e-2 | 2.361e-2 | 1.10 |
| 45 | 8.147e-4 | 1.087e-3 | 0.80 |
| 60 | 3.718e-4 | 4.439e-4 | 0.49 |
Iνmodel(x,y) = Idisk + ΣkAk exp[−½rk²]
Published disk size, component locations, widths, axial ratios, position angles, and the Band 8 beam set the reconstruction. Calibrated FITS and visibility-domain modelling remain required to reproduce the paper's observed contours or uncertainty map.
Prediction workbench
Spectra + image sequences
The workbench separates a quantitative interpolation that can be run now from image and line diagnostics that require calibrated, registered archive products. It never converts atmospheric novelty into an unsupported explosion probability.
Predict integrated flux only inside the measured 223.55–485.22 GHz interval, assuming the fitted power law remains valid.
Sν(ν*) = 0.518 [ν*/337.99]1.494 Jy
This band varies only α by ±0.133. It excludes normalization covariance, calibration systematics, intrinsic variability, and model discrepancy; it is not a full posterior-predictive interval.
| ν | Observed | Model | (O−M)/σ |
|---|---|---|---|
| 223.55 GHz | 0.28 Jy | 0.279 Jy | 0.06 |
| 337.99 GHz | 0.51 Jy | 0.518 Jy | -0.19 |
| 485.22 GHz | 0.90 Jy | 0.888 Jy | 0.13 |
Measurements: Dent et al. 2026. This interpolation describes the received sub-mm atmosphere; it does not determine the core-burning stage.
Load up to 5,000 aligned PNG, JPEG, or WebP frames. Files remain in this browser session and are not transmitted. The century-scale record is photometry, not a sequence of resolved photographs; use the historical light curve above for that evidence.
Unzip it, then select all three numbered PNG files above. These August 2023 Bands 6/7/8 paper panels test visual blinking only; they are not a calibrated time sequence.
For additional registered frames or calibrated archive-product details, email Biswajit Jana or connect on LinkedIn.
R(x,y) = [I₂(x,y) − I₁(x,y)] / √[σ₁²(x,y) + σ₂²(x,y)]
Quantitative residuals require common astrometry, pixel scale, units, flux scale, and PSF/synthesised beam. This viewer intentionally performs visual blinking only; numerical differencing belongs in the FITS pipeline.
The placeholder is an attributed paper figure, not a time-series datum. Reduced-motion mode disables automatic blinking; arrow controls remain available.
v ≈ c(ν₀ − ν)/ν₀
v̄ = Σ Iᵢvᵢ / Σ Iᵢ
Compare centroid, FWHM, skewness, line ratios, and channel-map morphology. A line shift is not automatically bulk stellar motion; opacity and asymmetric flows must be modelled.
ln L = −½ Σ[(yᵢ−mᵢ)²/(σᵢ²+s²) + ln 2π(σᵢ²+s²)]
The nuisance term s represents excess scatter or model discrepancy. Without it, a precise instrument can make an incomplete physical model look falsely certain.
p(y*|y,M) = ∫ p(y*|θ,M)p(θ|y,M)dθ
Hold out whole epochs, not random pixels or adjacent channels. A useful forecast must reproduce unseen epochs and remain calibrated under instrument and wavelength changes.
Evolutionary clock
Assumption switch
The disagreement is scientifically useful only when the pulsation assignments and companion interpretation stay visible.
Scenario A
~400/416 d fundamental · ~2100/2170 d companion/LSP
Collapse is not imminent under this model family.Joyce et al. 2020 + companion evidenceChanging the pulsation-mode assignment changes the inferred evolutionary stage. Neither panel is a direct measurement of the core.
Pn = Qn √[R³/(GM)]
The mode constant Qn depends on radial order and stellar structure. Assigning 416 d or 2200 d to the fundamental therefore changes the inferred radius and evolutionary state; the periods cannot be swapped without recomputing the stellar model.
PLSP/PFM ≈ 2170/416 = 5.22
A companion orbit naturally supplies a slow clock independent of radial acoustic pulsation. This is why identifying every long period as a pulsation is not a neutral assumption.
Statistical inference
Inference begins with a generative assumption
“These measurements are more compatible with scenario A under the stated likelihood, priors, and pulsation assignment.”
“A remote core-collapse event occurred at a coordinate time from which no causal signal has reached Earth.”
p(Mk|y) ∝ p(y|Mk) p(Mk)
Model-family weights are conditional on the prior, likelihood, data selection, and discrepancy model. Report sensitivity to each; never print a scenario percentage without those ingredients.
Core-collapse watch
Neutrino watch
Surface light constrains atmosphere and pulsation. Evolutionary models provide conditional long-range inference. A genuine late-stage warning is more directly tied to rising pre-supernova neutrino emission.
Super-Kamiokande pre-supernova alert studyΦν(E,t) = Lν(t) f(E,t) / [4πD² ⟨Eν⟩]
Detector counts fold this flux through cross-section, target mass, efficiency, threshold, and background. A pre-supernova alert is a near-term messenger calculation, not a centuries-long optical forecast.
Supernova laboratory
GPU-accelerated conditional forward model
The default branch renders atmospheric evolution without inserting a supernova through 3026 CE. A separate disputed branch lets the observer impose an arrival epoch from 2056–2326 CE and follow shock breakout, free expansion, wind-driven deceleration, and the transition from young to evolved supernova remnant.
A limb-darkened global disk with few-percent H-band asymmetry and resolved bright structure—not a perfectly smooth surface. Ohnaka et al. 2011 · Haubois et al. 2009
Band 7/8 structure includes an ≈800 K hot enhancement, radius deviations up to ±6%, and weak emission to ≈2.5 R★. Dent et al. 2026
The renderer targets a lower disk-integrated RMS; observed local upflows and downflows can be much faster. López Ariste et al. 2018
Large convective cells can mimic a velocity dipole, and the 2023 ALMA data show no clear rotation signature. Ma et al. 2024
Coefficients are nondimensional surface-layer closures. They alter the solved flow field rather than merely changing colour. The worker maps one numerical step to 0.25 accelerated surface day; it is not synchronized to the compressed 1000-year evolutionary slider.
∂ρ/∂t + ∇·(ρv) = 0
Semi-Lagrangian transport advances density while a divergence term supplies compressional response. Weak relaxation prevents secular mass drift in the reduced surface layer.
Dv/Dt = −∇p/ρ + αgT′r̂ + ν∇²v
Spherical pressure gradients, buoyancy, drag and viscous diffusion evolve the horizontal and radial velocity fields. Rotation is not imposed because the current observational interpretation is disputed.
DT/Dt = −(γ−1)T∇·v + κ∇²T + Qconv − T′/τrad
Compression heats, expansion cools, thermal diffusion smooths grid scales, buoyant transport sustains cells, and radiative relaxation returns perturbations toward the 3690 K near-infrared continuum anchor.
R = θD/2 · g = GM/R² · L = 4πR²σTeff⁴
θ = 42.49 mas and D = 172 pc give R ≈ 3.65 AU. A representative M = 17.5 M☉ gives log g ≈ -0.11 and vesc ≈ 92 km s⁻¹.
The surface shape now stays within observed near-IR and sub-mm asymmetry scales, while colour and radius change with the selected emitting layer. It remains a reduced spherical surface solver—not a three-dimensional radiation-hydrodynamics calculation. The radio view is explicitly false-colour; opacity, line formation, ionisation, deep stratification, shock capturing, magnetic fields, dust radiative transfer and calibrated boundary conditions remain unresolved. The preferred model does not predict core collapse anywhere on this timeline through 3026 CE.
Author synthesis
Signed conditional forecast · Biswajit Jana
I adopt Δt = 200,000 years as one representative value inside the preferred “hundreds of thousands of years” model family. It is not a fitted mean, median, confidence interval, or countdown.
This branch is compatible with early core-helium burning and the independent companion interpretation. The literature horizon is hundreds of thousands of years. My representative 200,000-year point maps to approximately 202,026 CE at Earth.
Goldberg, Joyce & Molnár 2024This branch gives a literature horizon of several dozen to several hundred years: an illustrative Δt = 30–300 years maps to roughly 2056–2326 CE. The required large radius is in tension with angular- diameter constraints, and the companion weakens the need for this mode assignment.
Saio et al. 2023Molnár, Joyce & Leung 2023 critiqueIt predicts when a causal supernova messenger would reach Earth under my preferred model interpretation. It does not establish Betelgeuse’s inaccessible present state, and atmospheric images or spectra alone cannot turn this order-of-magnitude synthesis into an exact date.
— Biswajit Jana, 30 August 2026
Scientific boundary
Every later model in this repository is required to separate measured observables, calculated quantities, simulations, model-dependent claims, and speculation.